Environmental Product Declaration
The Uni-Bell PVC Pipe Association (PVCPA) has published the first North American industry-wide environmental product declaration (EPD) for water and sewer piping, and it has been verified by NSF Sustainability, a division of global public health organization NSF International.<br>


Environmental Product Declaration
E N D
Presentation Transcript
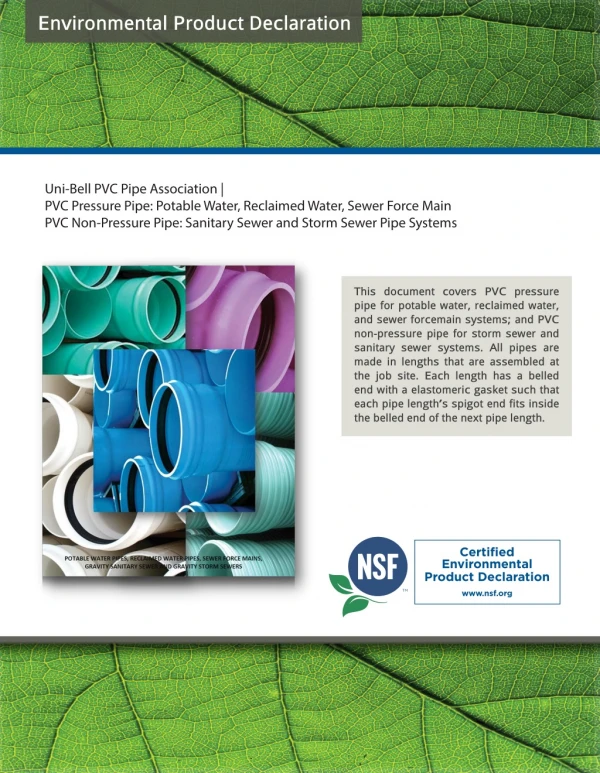
Uni-Bell PVC Pipe Association ENVIRONMENTAL PRODUCT DECLARATION PVC and PVCO Pressure Pipe: Potable Water, Reuse Water, Sanitary Force Main PVC Nonpressure Pipe: Sanitary Sewer and Gravity Storm Water This document covers PVC and PVCO pressure pipe for potable water, reuse water, and sanitary force main systems; and PVC nonpressure pipe for gravity storm water and sanitary sewer systems. All pipes are made in lengths that are assembled at the job site. Each length has a belled end with a elastomeric gasket such that each pipe length’s spigot end fits inside the belled end of the next pipe length. Verified LCA Conformity to Product Category Rule (PCR-1002) and ISO 14025
ENVIRONMENTAL PRODUCT DECLARATION EPD Program Operator NSF International 789 N. Dixboro Rd. Ann Arbor, MI 48105 USA www.nsfsustainability.org 2 Date of Issue: March 21, 2023 Period of Validity: 5 years Declaration#: EPD10047
ENVIRONMENTAL PRODUCT DECLARATION ENVIRONMENTAL PRODUCT DECLARATION (EPD) VERIFICATION EPD Information Program Operator NSF International Uni-Bell PVC Pipe Association 201 E. John Carpenter Freeway, Suite 750 Irving, TX 75062 Declaration Holder Product: PVC Pipe Date of Issue: March 21, 2023 Declaration Number: EPD10047 Period of Validity: 5 Years This EPD was independently verified by NSF International in accordance with ISO 14025: Internal External Jack Geibig, EcoForm, LLC jgeibig@ecoform.com This life cycle assessment (LCA) was independently verified in accordance with ISO 14044, ISO 21930, and the reference Product Category Rule (PCR). Jack Geibig, EcoForm, LLC jgeibig@ecoform.com LCA Information Potable Water, Reuse Water, Gravity Storm Water, Sanitary Force Main and Sanitary Sewer Pipe Systems, March, 2022 Basis LCA Cara Vought, Technical Manager Sustainable Solutions Corporation cara@sustainablesolutionscorporation.com LCA Preparer PCR Information ICC Evaluation Services (ICC-ES) (https://icc-es.org/environmental-program/) Program Operator Product Category Rules for Rigid and Flexible Building Piping Systems in North America (PCR-1002) Reference PCR Date of Issue 02-01-2019 Greg Johnson – Johnson & Associates Consulting Services Allan Bilka, R.A. – Senior Staff Architect, ICC Mark Reddin – Uponor PCR review was conducted by: This document is intended for Business-to-Customer (B2C) applications. EPDs according to different PCR documents or programs may not be comparable. The details within this document represent industry-averaged performance and data. Only EPDs that are prepared from cradle-to-grave life cycle results and based on the same function, reference service life (RSL) quantified by the same functional unit, and meeting all the conditions in ISO 14025, Section 6.7.2 shall be permitted to be used to assist purchasers and users in making informed comparisons between products. EPD Program Operator NSF International 789 N. Dixboro Rd. Ann Arbor, MI 48105 USA www.nsfsustainability.org 3 Date of Issue: March 21, 2023 Period of Validity: 5 years Declaration#: EPD10047
ENVIRONMENTAL PRODUCT DECLARATION EXECUTIVE SUMMARY PVC pipe has low cradle-to-grave environmental impacts. For pressure pipe, the most important drivers for environmental impacts are pipe installation and use phase. Although the use phase has the largest impact on the life cycle, PVC pipe is designed to minimize use-phase impacts due to the smooth surface of the pipe wall that reduces the frictional energy loss from pumping pressurized water through the system. For nonpressure pipe, installation of pipe is the primary driver of impacts. For both pressure and nonpressure pipe, PVC resin is a significant contributor. It is important to realize that PVC pipe’s use phase is not impacted by decline of pipe properties, since PVC’s hydraulic characteristics do not deteriorate with age. There has been an overall 6% reduction of embodied carbon and most other environmental impacts compared to the 2015 EPD, owing to improvements in PVC pipe manufacturing and upstream production of PVC resin. This reduction does not include use phase impacts from pumping, since it is not included in embodied energy carbon calculations. Also, there was a 20% reduction in electricity use during the extrusion process, as well as a 66% reduction in water use during PVC pipe manufacturing. Electricity is the dominant driver in manufacturing, so any reductions here are significant for the manufacturing stage. Efforts by the participating manufacturers to reduce their impacts include production increases, energy efficiency projects, and increased water tracking and reuse. SUMMARY OF EMBODIED CARBON AND ENERGY The following table provides a summary of the cradle-to-gate embodied carbon (that is, the A1-A3 global warming potential) as well as the cradle-to-gate embodied energy (cumulative energy demand) of the products. Please note that the embodied energy includes renewable and non-renewable energy sources used for fuel as well as for feedstock materials. For further breakdown among energy sources, please see each use of resources tables per product. TABLE 1: SUMMARY OF EMBODIED CARBON AND ENERGY Embodied Carbon A1-A3 Embodied Energy A1-A3 Product MJ / 1,000 ft kg CO2 eq / 1,000 ft 8” DR 18 AWWA C900 9.10E+03 2.64E+05 8” DR 25 AWWA C900 6.70E+03 1.95E+05 24” DR 25 AWWA C900 5.89E+04 1.69E+06 8” PC 235 AWWA C909 6.38E+03 1.79E+05 24” PS 46 (Profile) ASTM F794 / AASHTO M304 3.19E+04 9.34E+05 8” PS 46 (Profile) ASTM F794 2.67E+03 7.71E+04 8” DR 35 ASTM D3034 4.31E+03 1.18E+05 24” PS 46 ASTM F679 3.06E+04 8.88E+05 EPD Program Operator NSF International 789 N. Dixboro Rd. Ann Arbor, MI 48105 USA www.nsfsustainability.org 4 Date of Issue: March 21, 2023 Period of Validity: 5 years Declaration#: EPD10047
ENVIRONMENTAL PRODUCT DECLARATION ADDITIONAL ENVIRONMENTAL INFORMATION Environmental and Health During Manufacture: There are no known environmental or health concerns associated with the physical manufacture of PVC pipe. Additionally, no known per- and polyfluoroalkyl substances (PFAS) are associated with PVC pipe production. Environmental and Health During Installation: There are no known environmental or health concerns related to installation of PVC pipe. Environmental and Health During Use: PVC pipe and fittings are resistant to chemicals generally found in water and sewer systems, preventing any leaching or releases to ground and surface water during the use of the piping system. No known chemicals are released internally into the water system. No known toxicity effects occur in the use of the product. Additionally, no known microplastics are associated with PVC pipe use. Extraordinary Effects: There are no known, relevant, extraordinary effects from water, fire, or mechanical destruction of these products. This includes wildfires, which do not impact PVC water and sewer infrastructure pipe since it is buried underground, insulated from heat generated above ground. Pressure and nonpressure pipe are designed to meet performance characteristics as cited in specific standards defined in the Product Description section. Any relevant testing data may be requested from individual manufacturers. DISCLAIMER This EPD was not written to support comparative assertions. Even for similar products, EPD results might not be comparable because of differences in data quality, functional units, use, and end-of-life stage assumptions. It is not recommended to compare EPDs with another organization as there may be differences in methodology, assumptions, allocation methods, data quality such as variability in datasets, and results of variability in assessment software tools used. This declaration represents an average performance based on production values of an industry- wide study for a calendar year. EPD Program Operator NSF International 789 N. Dixboro Rd. Ann Arbor, MI 48105 USA www.nsfsustainability.org 5 Date of Issue: March 21, 2023 Period of Validity: 5 years Declaration#: EPD10047
ENVIRONMENTAL PRODUCT DECLARATION PRODUCT DESCRIPTION The PVC pipe industry recognizes the benefits of communicating credible, science-based, and transparent environmental information about its products. This EPD covers cradle-to-grave impacts of municipal piping systems in North America using a functional unit of 1,000 feet for eight different pipe products, used in various applications, to assist with measuring and understanding the environmental impacts of PVC pipe across the life cycle. The eight PVC pipe products examined are used for both pressure applications (potable water pipes, reuse water pipes, and sanitary force mains), and nonpressure applications (sanitary sewer and gravity storm water). These products are listed in Table 2. Explanatory materials regarding product information may be found at uni-bell.org. FIGURE 1: IMAGE OF PVC PIPE TABLE 2: PRODUCTS INCLUDED IN STUDY Dimension Ratio/ Pipe Stiffness Product Mass of Functional Unit Application Standard Nominal Diameter Pressure Pipe AWWA C9001 8 in. DR 18 3,974 kg/1,000 ft Pressure Pipe AWWA C900 8 in. DR 25 2,900 kg/1,000 ft Pressure Pipe AWWA C900 24 in. DR 25 24,036 kg/1,000 ft Pressure Pipe AWWA C9092 ASTM F7943/ AASHTO M3044 ASTM F794 8 in. PC 235 2,499 kg/1,000 ft Storm Water 24 in. (profile wall) PS 46 14,211 kg/1,000 ft Storm Water 8 in. (profile wall) PS 46 1,228 kg/1,000 ft Sanitary Sewer ASTM D30345 8 in. (solid wall) DR 35 1,931 kg/1,000 ft Sanitary Sewer ASTM F6796 24 in. (solid wall) PS 46 16,343 kg/1,000 ft 1 AWWA C900 Polyvinyl Chloride (PVC) Pressure Pipe and Fabricated Fittings, 4 In. Through 60 In. (100 mm Through 1,500 mm). 2022. 2 AWWA C909 Molecularly Oriented Polyvinyl Chloride (PVCO) Pressure Pipe, 4 In. (100mm) and Larger. 2022. 3 ASTM F794 Standard Specification for Poly(Vinyl Chloride) (PVC) Profile Gravity Sewer Pipe and Fittings Based on Controlled Inside Diameter. 2021. 4 AASHTO M304 Standard Specification for Poly(Vinyl Chloride) (PVC) Profile Wall Drain Pipe and Fittings Based on Controlled Inside Diameter. 2011. 5 ASTM D3034 Standard Specification for Type PSM Poly(Vinyl Chloride) (PVC) Sewer Pipe and Fittings. 2021. 6 ASTM F679 Standard Specification for Poly(Vinyl Chloride) (PVC) Large-Diameter Plastic Gravity Sewer Pipe and Fittings. 2021. EPD Program Operator NSF International 789 N. Dixboro Rd. Ann Arbor, MI 48105 USA www.nsfsustainability.org 6 Date of Issue: March 21, 2023 Period of Validity: 5 years Declaration#: EPD10047
ENVIRONMENTAL PRODUCT DECLARATION FUNCTIONAL UNIT The environmental impacts are reported per functional unit of a product, and the functional unit is the basis for comparison in an LCA. For PVC pipe, the functional unit for this EPD is 1,000 feet of installed pipe with belled ends every 20 feet for every 8- and 24-inch pipe, over a 50-year building life. Per the Product Category Rule (PCR), a building service life is assumed at 50 years; however, PVC pipe used for water and sewer infrastructure is designed to service systems for 100 years. In fact, research studies, and dig-ups after 70 years of use confirm that PVC pipe lasts in excess of 100 years.7,8 For this EPD, the pumping energy required to pump water through the pipe during the use stage is considered for 50 years. Per the PCR, fittings must also be included. As these piping systems are belled, fittings are not required to join the pipes together and are only used as needed for a project installation. A typical PVC water or sewer pipe system uses far fewer fittings than required for this PCR. However, for the purposes of this EPD, 258 fittings were assumed as required by the PCR standard for pressure pipe systems and 234 fittings were used for sanitary sewer. These values are reported in a separate Appendix at the end of this document as systems are variable in the number and type of fittings required. MANUFACTURING LOCATIONS This study uses data from Uni-Bell PVC Pipe Asssociation (PVCPA) members including seven manufacturers and 35 facilities representing roughly 90% of municipal water and sewer PVC pipe product capacity in the United States and Canada. The participating manufacturers are listed in Table 3 and shown on a map in Figure 2. PVCPA is the non-profit trade association representing North America’s PVC water and sewer infrastructure pipe manufacturers. The Association is the authoritative source on PVC pipe and has served the engineering, regulatory, public health, and standardization communities since 1971. FIGURE 2: PVC PIPE LCA STUDY PARTICIPANTS’ MANUFACTURING LOCATIONS TABLE 3: PARTICIPATING PVC PIPE MANUFACTURERS Diamond Plastics Corporation IPEX, Inc. Jet Stream by PipeLife JM Eagle Corporation National Pipe & Plastics Corporation Sanderson Pipe Corporation Westlake Pipe & Fittings 7 Folkman, Steven. PVC Pipe Longevity Report: Affordability & the 100+ Year Benchmark Standard. Utah State University Buried Structures Laboratory. May 2014. 8 Burn, S. et. al., “Long-term Performance Prediction for PVC Pipes,” AWWARF Report 91092F, May 2006. EPD Program Operator NSF International 789 N. Dixboro Rd. Ann Arbor, MI 48105 USA www.nsfsustainability.org 7 Date of Issue: March 21, 2023 Period of Validity: 5 years Declaration#: EPD10047
ENVIRONMENTAL PRODUCT DECLARATION SYSTEM BOUNDARY The system boundary of this EPD is cradle-to-grave. This project considers the life cycle activities from resource extraction through installation and end-of-life effects. The boundary covers the product, construction process, use, and end-of-life stages, as seen in Table 4. Capital goods and infrastructure flows have been excluded from the unit processes used to model the LCIA, as these goods do not significantly impact the LCA. TABLE 4: SYSTEM BOUNDARY Raw Material A1 X Extraction and Processing Product A2 X Transport A3 X Manufacturing A4 X Transport Construction Installation A5 X Construction/Installation MATERIAL CONTENTS PVC pipe compound ingredients are given in the units Parts per Hundred Resin (PHR). This means that for every 100 pounds of resin, the PHR amount should be added to the compound when mixing. This ensures consistency throughout the industry. The industry average PVC pipe formations are listed in Table 5. Any hazardous or toxic materials or any substances that were intentionally added to the product system were considered and included in the life cycle inventory. B1 X Use B2 X Maintenance B3 X Repair Use B4 X Replacement B5 X Refurbishment B6 X Operational Energy Use Operational Water Use Deconstruction/ Demolition B7 X C1 X C2 X Transport End-of-Life C3 X Waste Processing C4 X Disposal D MND Reuse Benefits of Loads Beyond the System Boundary D MND Recovery D MND Recycling *MND = module not disclosed EPD Program Operator NSF International 789 N. Dixboro Rd. Ann Arbor, MI 48105 USA www.nsfsustainability.org 8 Date of Issue: March 21, 2023 Period of Validity: 5 years Declaration#: EPD10047
ENVIRONMENTAL PRODUCT DECLARATION TABLE 5: AVERAGE PVC PIPE PRODUCT FORMULATIONS (A1) Parts per Hundred Resin (PHR) ASTM F794 / AASHTO M304 AWWA C909 ASTM F794 ASTM D3034 ASTM F679 AWWA C900 Product Recipe 8” 8” 24” DR 25 8” 24” PS 46 Profile 8” PS 46 Profile 8” 24” PS 46 DR 18 DR 25 PC 235 DR 35 PVC 100 100 100 100 100 100 100 100 Stabilizer 0.59 0.56 0.64 0.50 0.61 0.50 0.54 0.57 Titanium Dioxide 1.03 1.28 0.78 0.55 0.17 0.19 0.89 0.74 Calcium Carbonate 4.96 3.90 5.09 5.30 13.57 9.94 16.71 23.10 Pigments/Colorants 0.15 0.15 0.08 0.03 0.64 0.59 0.32 1.61 Calcium Stearate 0.77 0.80 0.88 0.40 0.54 0.61 6.05 0.89 Polyethylene Wax 0.30 0.07 0.18 0.19 0.18 0.20 0.31 0.27 Wax 0.99 0.47 1.32 0.94 1.36 1.46 1.00 1.01 Combined Wax 0.24 0.33 0.09 — — — 0.18 0.07 Impact Modifier — — — — 0.28 — 0.03 — Processing Aid — — 0.12 — 0.32 — — — Recycled PVC — — — — — — 3.43 — Total 109 108 109 108 118 113 129 128 Total Weight (kg/1,000 ft) 3,970 2,900 24,030 2,500 14,210 1,230 1,930 16,350 *Please note that the parts per hundred value by ingredient may be divided by the total parts to determine the percentage in the formulation. Fitting formulations are considered to be similar; formulations are similar for C900 fittings with the weight of a fitting being 12.5 lbs (5.7 kg) or 130 lbs (59 kg) for an 8- and 24-inch pressure pipe, respectively. For sanitary sewer and storm water, 8-inch fittings are assumed to be 4.5 lbs (2.0 kg) and 24-inch fittings are assumed to be 60 lbs (27.2 kg) per piece. Packaging materials are pallets with other procedural materials, such as paper labels. The main components of the pallets are wood, metal, plastic, cardboard, and paper. Packaging amounts are provided in Table 7. EPD Program Operator NSF International 789 N. Dixboro Rd. Ann Arbor, MI 48105 USA www.nsfsustainability.org 9 Date of Issue: March 21, 2023 Period of Validity: 5 years Declaration#: EPD10047
ENVIRONMENTAL PRODUCT DECLARATION MANUFACTURING The production process begins when the raw materials are blended together, after which the compound flows into an electrically heated extruder. The compound passes through a die at the end of the extruder, where it is formed into a pipe shape. The pipe then moves through a sizing sleeve that provides dimensional accuracy. Solid-wall pipe is then water cooled, cut to length, and labeled as the pipe moves to the end of the production line. PVCO pipe has an additional step to form it to the final dimensions. Profile-wall pipe undergoes additional processing to form the profile shape. At the end of the production line, the pipe is belled and pressure tested (for pressure-class pipe). The pipe is then packaged and prepared for shipment from the manufacturing facility. The packaging is typically a set of wooden frames that hold the bundle of pipes together. Packaged pipe is loaded onto trucks for shipping. Figure 3 details the process flow. FIGURE 3: PVC PIPE MANUFACTURING PROCESS Raw Orienting (PVCO Pipe Only) Compound Mixing Materials Storage Extruding Cutting Hydrotesting (Pressure Pipe Only) Belling Packaging Shipping EPD Program Operator NSF International 789 N. Dixboro Rd. Ann Arbor, MI 48105 USA www.nsfsustainability.org 10 Date of Issue: March 21, 2023 Period of Validity: 5 years Declaration#: EPD10047
ENVIRONMENTAL PRODUCT DECLARATION DISTRIBUTION The final PVC pipes are shipped throughout North America. Each participating facility provided average transportation distances for the products investigated in this study. A weighted average was taken for each product in this study as seen in Table 6. All manufacturing facilities ship the PVC pipe via truck. TABLE 6: TRANSPORT TO THE CONSTRUCTION SITE (A4) 8” 8” 24” DR 25 C900 8” 24” PS 46 Profile 8” 8” 24” PS 46 F679 Product Unit DR 18 C900 DR 25 C900 PC 235 C909 PS 46 Profile DR 35 D3034 Fuel Type Diesel Vehicle Type Truck Average Transport Distance km 461 430 416 762 614 655 475 263 % by mass 90 90 90 90 90 90 90 90 Capacity Utilization Weight of Pipe Products Transported Weight of Pipe Fittings Transported Volume of Pipe Products Transported kg 3,970 2,900 24,030 2,500 14,210 1,230 1,930 16,350 kg 1,463 1,463 15,213 1,463 6,368 478 478 6,368 m3 21.2 21.2 56.6 21.2 56.6 21.2 21.2 56.6 INSTALLATION The vast majority of PVC pipe is installed via open-cut; however, PVC pipe can also be installed via trenchless methods. For the purposes of this EPD, only open-cut installation methods were considered. Alternative installation methods would change EPD values. Installation of PVC pipe is assumed to be similar to other open-cut pipe installation, requiring the digging and refilling of a trench. The trench depth and time required to dig and refill it varies widely per region, soil type, climate, existing infrastructure, equipment operator, local convention, and other factors, so the actual installation time and effort is widely variable. For 8-inch pipe, the trench width used was at least 24 inches. For 24-inch pipe, the trench width extended at least 36 inches. Typically, a hydraulic digger is used to dig the trench, and a small loader refills the trench. After installation, any packaging for the product is discarded. EPD Program Operator NSF International 789 N. Dixboro Rd. Ann Arbor, MI 48105 USA www.nsfsustainability.org 11 Date of Issue: March 21, 2023 Period of Validity: 5 years Declaration#: EPD10047
ENVIRONMENTAL PRODUCT DECLARATION FIGURE 4: TRENCH CROSS-SECTION DIAGRAM Two scenarios were identified for this study. The first scenario represents a trench depth of 4 feet for the 8-inch diameter pipe, with an estimated 15 hours of machine runtime for 1,000 feet of pipe. The second scenario represents a trench depth of 10 feet for the 24-inch diameter pipe, with an estimated 25 hours of machine runtime for 1,000 feet of pipe. EPD Program Operator NSF International 789 N. Dixboro Rd. Ann Arbor, MI 48105 USA www.nsfsustainability.org 12 Date of Issue: March 21, 2023 Period of Validity: 5 years Declaration#: EPD10047
ENVIRONMENTAL PRODUCT DECLARATION INSTALLATION cont. Diesel fuel usage rates are estimated to be 8 gallons/hour (30.3 liters/hour) for the digger9 and 2 gallons/hour (7.6 liters/ hour) for the loader10. Therefore the 15-hour baseline scenario assumes 150 gallons (567.8 liters) of diesel is required to install 1,000 feet of pipe. The longer 25-hour scenario assumes 360 gallons (1,362.8 liters) of diesel is required to install 1,000 feet of pipe. No shoring was considered. Gravel and sand were assumed to be used in the bedding and haunching of the trench, per the Handbook of PVC Pipe: Design & Construction manual. A combined bulk density of 120 lb/ft3 was assumed.11 Not all pipe installations require bedding, and most pressure pipe installations can use native soil. According to these scenarios and the functional unit of the products, 30 hours of labor have been assumed for the installation phase. TABLE 7: CONSTRUCTION / INSTALLATION ASSUMPTIONS (A5) 24” PS 46 F679 8” 8” 24” PS 46 Profile 24” DR 25 C900 8” 8” 8” PS 46 Profile DR 35 D3034 PC 235 C909 DR 25 C900 Product Unit DR 18 C900 Ancillary Materials Gravel t 61.9 61.9 80 61.9 80 61.9 61.9 80 Sand t 12.4 12.4 16.2 12.4 16.2 12.4 12.4 16.2 Disinfectant Net Freshwater Consumption Diesel kg 0.32 0.32 2.6 0.32 n/a n/a n/a n/a m3 10.4 10.4 10.4 10.4 n/a n/a n/a n/a gal 150 150 366 150 366 150 150 366 Electricity Other Energy Carriers Product Loss kWh 0.3 0.3 13.0 0.3 n/a n/a n/a n/a MJ n/a n/a n/a n/a n/a n/a n/a n/a kg 199 145 1,202 125 711 61 97 817 Waste Materials Output Materials (Landfill) Packaging Materials kg 199 145 1,202 125 711 61 97 817 kg 199 145 1,202 125 711 61 97 817 Paper kg 3.19E-02 4.56E-02 2.28E-01 1.99E-01 3.48E+00 9.94E-01 4.94E-03 3.67E+00 Plastic kg 5.93E+00 6.11E+00 5.26E+01 2.94E+01 5.00E+00 7.91E-01 1.98E+00 1.09E+01 Cardboard kg 3.03E-02 1.68E-02 1.90E-01 0.00E+00 1.07E-02 4.06E-03 1.81E-02 8.85E-02 Metal kg 4.91E-01 3.14E-01 6.88E+00 1.97E+00 8.21E+00 1.04E+00 3.36E-01 2.42E+00 Wood Biogenic Carbon Contained in Packaging Direct Emissions kg 5.80E+01 7.15E+01 1.43E+02 3.57E+02 3.47E+02 2.69E+01 1.72E+01 6.00E+01 kg CO2 1.06E+02 1.31E+02 2.62E+02 6.54E+02 6.35E+02 4.93E+01 3.16E+01 1.10E+02 kg n/a n/a n/a n/a n/a n/a n/a n/a VOC Emissions kg n/a n/a n/a n/a n/a n/a n/a n/a 9 Forum on Heavy Equipment. https://www.heavyequipmentforums.com/showthread.php?5804-Fuel-Consumption. Accessed March 2013. 10 Forum on Forestry Forum. https://www.forestryforum.com/board/index.php?topic=14063.0. Accessed March 2013. 11 SI Metric. Density of Dry Material Table. https://www.simetric.co.uk/si_materials.htm. Accessed September 25, 2013. EPD Program Operator NSF International 789 N. Dixboro Rd. Ann Arbor, MI 48105 USA www.nsfsustainability.org 13 Date of Issue: March 21, 2023 Period of Validity: 5 years Declaration#: EPD10047
ENVIRONMENTAL PRODUCT DECLARATION REFERENCE SERVICE LIFE The following assumptions were made for this study. TABLE 8: REFERENCE SERVICE LIFE Subject Unit Potable Water Storm Water Sanitary Sewer Reference Service Life (RSL) Years 50 50 50 Estimated Service Life (ESL) Years 100 100 100 Declared Product Properties Design Application Parameters & Use Conditions Click here for resources on installation practices for PVC pressure pipe. Click here for resources on installation practices for PVC nonpressure pipe. Quality of Work Outdoor Environment Indoor Environment n/a n/a n/a Water Loss Liters — — — Number of Replacements # 0 0 0 Please refer to the maintenance guides provided by the manufacturer, or on PVCPA’s resource page. Maintenance USE It is assumed that replacements or repairs of pipes will not be necessary during the course of 50 years, which is the service life per the PCR. In pressure-pipe systems, pumping energy is required to overcome friction between the pipe wall and the flowing fluid. To calculate the amount of energy required of the pumps for the friction head from the PVC pipe, the following assumptions were made. Note that 8,760 annual operating hours equal 24-hour, 365-day pumping. EPD Program Operator NSF International 789 N. Dixboro Rd. Ann Arbor, MI 48105 USA www.nsfsustainability.org 14 Date of Issue: March 21, 2023 Period of Validity: 5 years Declaration#: EPD10047
ENVIRONMENTAL PRODUCT DECLARATION The friction head loss through 1,000 feet of pipe was calculated using the Hazen-Williams equation. The assumed PCR service life is 50 years; however, the pipe product’s estimated service life is actually longer and designed for 100 years. The selected service life used in the project reflects the PCR requirements; however, industry experts and studies by Utah State University13 as well as the American Water Works Association and Water Research Foundation (AWWARF)14 confirm that PVC pipe has a service life in excess of 100 years. TABLE 9: OPERATIONAL USE ASSUMPTIONS Parameter Value Water Flow Velocity in PVC Pipe 2 feet/second Pump Efficiency 75% Operating Hours Per Year 8,760 Length of Pipe 1,000 feet Elevation Increase 0 feet 15012 Hazen-Williams Coefficient for PVC TABLE 10: OPERATIONAL ENERGY USE CALCULATION RESULTS FOR C900 & C909 PVC PIPES Product 8” DR 18 C900 8” DR 25 C900 24” DR 25 C900 8” PC 235 C909 Hazen-Williams Coefficient 150 150 150 150 Inside Diameter (inch) 8.04 8.33 23.74 8.44 Flow Rate (gpm) at 2 ft/s velocity 317 339 2,758 349 Pumping Energy (kWh/yr) 1,150 1,190 2,860 1,200 Operational Energy Use for 50 years (MJ) 20,700 21,420 51,480 21,600 END-OF-LIFE While products are traditionally left in the ground, this study assumes that piping systems are replaced after their reference service life with a new piping system. However, most water and sewer systems are left in place without removal. For deconstruction, no additional energy was assumed as typically when pipe is actively removed a replacement system is being installed; therefore, the installation energy of the next system would capture any removal of a piping system. To avoid double counting of diesel impacts, all energy is assumed in the installation of the new system. PVC pipe is 100% recyclable so if the product is removed from the ground after its service life the preferred end-of-life is recycling. PVC pipe can be recycled back into itself up to eight times without a reduction in mechanical properties. However, owing to its longevity, most of it has yet to enter the recycling stream. Disposal in a municipal landfill is permissible and should be done in accordance with local, state, and federal regulations. For this study, disposal was modeled in compliance with the PCR and is not a significant contributor to environmental impacts. 12Handbook of PVC Pipe: Design and Construction. Fifth Edition. Uni-Bell. (2012) 9.7. 13 Folkman, Steven. PVC Pipe Longevity Report: Affordability & the 100+ Year Benchmark Standard. Utah State University Buried Structures Laboratory. May 2014. 14 Burn, S. et. al., “Long-term Performance Prediction for PVC Pipes,” AWWARF Report 91092F, May 2006. EPD Program Operator NSF International 789 N. Dixboro Rd. Ann Arbor, MI 48105 USA www.nsfsustainability.org 15 Date of Issue: March 21, 2023 Period of Validity: 5 years Declaration#: EPD10047
ENVIRONMENTAL PRODUCT DECLARATION TABLE 11: END-OF-LIFE ASSUMPTIONS (C1-C4) 8” DR 18 C900 8” DR 25 C900 24” DR 25 C900 8” PC 235 C909 Product Unit Collected Separately (Pipe) kg 3,974 2,900 24,036 2,499 Collection Process Collected Separately (Fittings) Collected with Mixed Construction Waste kg 1,463 1,463 15,213 1,463 kg n/a n/a n/a n/a Distance Traveled to Disposal km 50 50 50 50 Reuse kg n/a n/a n/a n/a Recycling kg n/a n/a n/a n/a Landfill (Pipe) kg 3,974 2,900 24,036 2,499 Recovery and Disposal Landfill (Fittings) kg 1,463 1,463 15,213 1,463 Incineration kg n/a n/a n/a n/a Incineration (with Energy Recovery) kg n/a n/a n/a n/a Energy Conversion kg n/a n/a n/a n/a Removals of Biogenic Carbon kg n/a n/a n/a n/a 24” PS 46 Profile 8” PS 46 Profile 8” DR 35 D3034 24” PS 46 F679 Product Unit Collected Separately (Pipe) kg 14,211 1,228 1,931 16,343 Collection Process Collected Separately (Fittings) kg 6,368 478 478 6,368 Collected with Mixed Construction Waste kg n/a n/a n/a n/a Distance Traveled to Disposal km 50 50 50 50 Reuse kg n/a n/a n/a n/a Recycling kg n/a n/a n/a n/a Landfill (Pipe) kg 14,211 1,228 1,931 16,343 Recovery and Disposal Landfill (Fittings) kg 6,368 478 478 6,368 Incineration kg n/a n/a n/a n/a Incineration (with Energy Recovery) kg n/a n/a n/a n/a Energy Conversion kg n/a n/a n/a n/a Removals of Biogenic Carbon kg n/a n/a n/a n/a EPD Program Operator NSF International 789 N. Dixboro Rd. Ann Arbor, MI 48105 USA www.nsfsustainability.org 16 Date of Issue: March 21, 2023 Period of Validity: 5 years Declaration#: EPD10047
ENVIRONMENTAL PRODUCT DECLARATION METHODOLOGY Allocation: Per production mass at each facility; a weighted average based on production totals among manufacturers was conducted. Cut-Off Rules: Cut-off rules were followed as defined by ISO 14044. All known flows were included in the system boundary, and no flows were excluded. No hazardous and toxic materials are added to the piping systems; any hazardous substances were considered and included in the life cycle inventory. The following items were cut-off using the cut-off criteria listed in the PCR: • Construction of capital equipment • Maintenance of operation and support equipment • Human labor and employee commute • Casings for pipe installed under structures • Shoring, soil compaction during installation of pipe Data Sources: ecoinvent v3.7 and US LCI Data Quality: • Primary Data: 2019 calendar year • Secondary Data: Representative of North America, based on the ecoinvent v3.7 recycled content database and the US LCI datasets, with datasets developed or updated within 10 years. o Vinyl resin data was leveraged from the 2021 published LCA study by Franklin Associates (a divison of ERM) as published in the Federal LCA Commons and US LCI database. • Secondary data were evaluated with regards to precision, completeness, consistency, reproducibility, representativeness, and uncertaintly. Based on these criteria, the data quality used throughout this study is considered high. Software: SimaPro v9.3 Period Under Review: Data from 2019 was collected and average based on production from each participating facility. Estimates and Assumptions: • Products are assumed to travel 500 miles in a diesel-powered truck to the building site. • Manual installation occurs with a 5% scrap rate. • Underground pipe is predominantly left in the ground at the end of the service life and not recovered for disposal in a landfill or incinerator nor recycled. EPD Program Operator NSF International 789 N. Dixboro Rd. Ann Arbor, MI 48105 USA www.nsfsustainability.org 17 Date of Issue: March 21, 2023 Period of Validity: 5 years Declaration#: EPD10047
ENVIRONMENTAL PRODUCT DECLARATION LIFE CYCLE IMPACT ASSESSMENT (LCIA) The impact categories analyzed for this EPD include: global warming potential, ozone depletion, acidification, eutrophication, and smog formation. The TRACI 2.1 version 4.1 and CML impact assessment methodologies were used to calculate the environmental impacts in this LCA. PRESSURE PIPE: 8” DR 18 AWWA C900 TABLE 12: 8” DR 18 AWWA C900 LIFE CYCLE IMPACT ASSESSMENT Disposal Stage Product Stage Construction Stage Use Stage Unit TRACI v2.1 (per 1,000 ft) A1 A2 A3 A4 A5 B1-B7 C1-C4 Global Warming Potential kg CO2 eq GWP 7.94E+03 1.28E+02 1.04E+03 1.69E+02 2.52E+03 2.72E+04 3.92E+01 Depletion Potential of the Stratospheric Ozone Layer kg CFC-11 eq 1.30E-03 4.87E-09 7.43E-05 6.45E-09 5.48E-05 2.10E-03 9.02E-06 ODP Acidification Potential AP kg SO2 eq 6.65E+01 1.83E+00 2.89E+00 1.01E+00 2.86E+01 6.88E+01 4.24E-01 Eutrophication Potential Photochemical Ozone Creation Potential kg N eq 3.56E+00 1.10E-01 3.39E+00 5.62E-02 3.17E+00 8.20E+01 4.95E-02 EP POCP kg O3 eq 3.43E+02 5.86E+01 4.37E+01 2.76E+01 8.42E+02 1.12E+03 1.08E+01 Disposal Stage Product Stage Construction Stage Use Stage Unit CML 2 Baseline 2001 (per 1,000 ft) A1 A2 A3 A4 A5 B1-B7 C1-C4 Global Warming Potential kg CO2 eq GWP 8.06E+03 1.28E+02 1.05E+03 1.69E+02 2.54E+03 2.74E+04 3.94E+01 Depletion Potential of the Stratospheric Ozone Layer kg CFC-11 eq 4.36E-04 4.83E-09 5.12E-05 6.38E-09 3.96E-05 1.42E-03 6.77E-06 ODP Acidification Potential kg SO2 eq AP 7.35E+01 1.40E+00 2.68E+00 8.33E-01 2.22E+01 6.17E+01 3.39E-01 Eutrophication Potential Photochemical Ozone Creation Potential Abiotic Depletion Potential for Fossil Resources kg PO4 eq EP 2.91E+00 3.10E-01 1.62E+00 1.48E-01 5.13E+00 4.00E+01 7.38E-02 POCP kg C2H4 eq 4.05E+00 3.13E-02 1.46E-01 3.84E-02 7.78E-01 3.18E+00 -3.43E-02 ADPF MJ 2.39E+05 1.64E+03 1.35E+04 2.17E+03 3.39E+04 3.56E+05 8.47E+02 EPD Program Operator NSF International 789 N. Dixboro Rd. Ann Arbor, MI 48105 USA www.nsfsustainability.org 18 Date of Issue: March 21, 2023 Period of Validity: 5 years Declaration#: EPD10047
ENVIRONMENTAL PRODUCT DECLARATION TABLE 13: 8” DR 18 AWWA C900 USE OF RESOURCES Disposal Stage C1-C4 Product Stage Construction Stage Use Stage Unit (per 1,000 ft) Use of Resources A1 A2 A3 A4 A5 B1-B7 Non-renewable Primary Resources Used as an Energy Carrier Renewable Primary Resources Used as an Energy Carrier Non-renewable Primary Resources with Energy Content Used as a Material Renewable Primary Resources with Energy Content Used as a Material Use of Secondary Materials Renewable Secondary Fuels Use of Non-renewable Secondary Fuels Fresh Water Consumption NRPRE MJ 2.36E+05 1.64E+03 1.92E+04 2.17E+03 3.62E+04 5.15E+05 8.53E+02 RPRE MJ 1.54E+03 0.00E+00 1.16E+03 0.00E+00 4.81E+02 4.88E+04 4.69E+00 NRPRM kg 3.96E+03 0.00E+00 2.36E+02 0.00E+00 0.00E+00 0.00E+00 0.00E+00 RPRM kg 1.10E+03 0.00E+00 0.00E+00 0.00E+00 0.00E+00 0.00E+00 0.00E+00 kg 0.00E+00 0.00E+00 0.00E+00 0.00E+00 0.00E+00 0.00E+00 0.00E+00 SM MJ 0.00E+00 0.00E+00 0.00E+00 0.00E+00 0.00E+00 0.00E+00 0.00E+00 RSF MJ 0.00E+00 0.00E+00 0.00E+00 0.00E+00 0.00E+00 0.00E+00 0.00E+00 NRSF m3 FW 2.62E+01 0.00E+00 4.15E+00 0.00E+00 2.34E+02 1.03E+02 6.19E-01 NRN Non-renewable Nuclear MJ 0.00E+00 0.00E+00 0.00E+00 0.00E+00 0.00E+00 0.00E+00 0.00E+00 TABLE 14: 8” DR 18 AWWA C900 OUTPUT FLOWS Disposal Stage C1-C4 Product Stage Construction Stage Use Stage Unit (per 1,000 ft) Parameter A1 A2 A3 A4 A5 B1-B7 Disposed-of Hazardous Waste Disposed-of Non- Hazardous Waste Disposed-of Radioactive Waste HWD kg 0.00E+00 0.00E+00 9.46E-02 0.00E+00 0.00E+00 0.00E+00 0.00E+00 kg 0.00E+00 0.00E+00 2.94E+01 0.00E+00 2.10E+02 0.00E+00 3.96E+03 NHWD kg 0.00E+00 0.00E+00 0.00E+00 0.00E+00 0.00E+00 0.00E+00 0.00E+00 RWD CRU Components for Reuse kg 0.00E+00 0.00E+00 0.00E+00 0.00E+00 0.00E+00 0.00E+00 0.00E+00 MFR Materials for Recycling kg 0.00E+00 0.00E+00 2.07E+01 0.00E+00 0.00E+00 0.00E+00 0.00E+00 Materials for Energy Recovery Exported Electrical Energy (Waste to Energy) Exported Thermal Energy (Waste to Energy) kg 0.00E+00 0.00E+00 0.00E+00 0.00E+00 0.00E+00 0.00E+00 0.00E+00 MET MJ 0.00E+00 0.00E+00 0.00E+00 0.00E+00 0.00E+00 0.00E+00 0.00E+00 EEE MJ 0.00E+00 0.00E+00 0.00E+00 0.00E+00 0.00E+00 0.00E+00 0.00E+00 EET BBPr Bio-Based Products kg CO2 eq 0.00E+00 0.00E+00 0.00E+00 0.00E+00 0.00E+00 0.00E+00 0.00E+00 BBPk Bio-Based Packaging kg CO2 eq -5.79E+01 0.00E+00 0.00E+00 0.00E+00 5.79E+01 0.00E+00 0.00E+00 EPD Program Operator NSF International 789 N. Dixboro Rd. Ann Arbor, MI 48105 USA www.nsfsustainability.org 19 Date of Issue: March 21, 2023 Period of Validity: 5 years Declaration#: EPD10047
ENVIRONMENTAL PRODUCT DECLARATION PRESSURE PIPE: 8” DR 25 AWWA C900 TABLE 15: 8” DR 25 AWWA C900 LIFE CYCLE IMPACT ASSESSMENT Disposal Stage Use Stage Product Stage Construction Stage Unit (per 1,000 ft) TRACI v2.1 A1 A2 A3 A4 A5 B1-B7 C1-C4 Global Warming Potential kg CO2 eq GWP 5.86E+03 1.56E+02 6.89E+02 1.14E+02 2.50E+03 2.81E+04 2.84E+01 Depletion Potential of the Stratospheric Ozone Layer kg CFC-11 eq 9.61E-04 2.47E-06 4.49E-05 4.36E-09 5.32E-05 2.17E-03 6.54E-06 ODP Acidification Potential kg SO2 eq AP 4.91E+01 2.21E+00 2.03E+00 6.83E-01 2.86E+01 7.12E+01 3.08E-01 Eutrophication Potential Photochemical Ozone Creation Potential kg N eq 2.80E+00 1.84E-01 2.90E+00 3.81E-02 3.09E+00 8.48E+01 3.59E-02 EP POCP kg O3 eq 2.53E+02 6.88E+01 3.10E+01 1.87E+01 8.41E+02 1.15E+03 7.80E+00 Disposal Stage Construction Stage Use Stage Product Stage Unit (per 1,000 ft) CML 2 Baseline 2001 A1 A2 A3 A4 A5 B1-B7 C1-C4 Global Warming Potential kg CO2 eq GWP 5.95E+03 1.56E+02 6.97E+02 1.15E+02 2.51E+03 2.83E+04 2.85E+01 Depletion Potential of the Stratospheric Ozone Layer kg CFC-11 eq 3.24E-04 2.28E-06 3.12E-05 4.32E-09 3.85E-05 1.47E-03 4.91E-06 ODP Acidification Potential kg SO2 eq AP 5.42E+01 1.71E+00 1.90E+00 5.64E-01 2.21E+01 6.39E+01 2.46E-01 Eutrophication Potential Photochemical Ozone Creation Potential Abiotic Depletion Potential for Fossil Resources kg PO4 eq EP 2.22E+00 3.87E-01 1.36E+00 9.98E-02 5.10E+00 4.14E+01 5.35E-02 POCP kg C2H4 eq 3.01E+00 4.16E-02 9.84E-02 2.60E-02 7.75E-01 3.29E+00 -2.48E-02 ADPF MJ 1.75E+05 2.19E+03 8.48E+03 1.47E+03 3.37E+04 3.68E+05 6.14E+02 EPD Program Operator NSF International 789 N. Dixboro Rd. Ann Arbor, MI 48105 USA www.nsfsustainability.org 20 Date of Issue: March 21, 2023 Period of Validity: 5 years Declaration#: EPD10047
ENVIRONMENTAL PRODUCT DECLARATION TABLE 16: 8” DR 25 AWWA C900 USE OF RESOURCES Disposal Stage C1-C4 Product Stage Construction Stage Use Stage Unit (per 1,000 ft) Use of Resources A1 A2 A3 A4 A5 B1-B7 Non-renewable Primary Resources Used as an Energy Carrier Renewable Primary Resources Used as an Energy Carrier Non-renewable Primary Resources with Energy Content Used as a Material Renewable Primary Resources with Energy Content Used as a Material Use of Secondary Materials Renewable Secondary Fuels Use of Non-renewable Secondary Fuels Fresh Water Consumption NRPRE MJ 1.24E+05 2.21E+03 1.29E+04 1.47E+03 3.59E+04 5.33E+05 6.18E+02 RPRE MJ 1.17E+03 1.56E+01 2.55E+03 0.00E+00 4.33E+02 5.05E+04 3.40E+00 NRPRM kg 5.21E+04 0.00E+00 0.00E+00 0.00E+00 0.00E+00 0.00E+00 0.00E+00 RPRM kg 1.34E+02 0.00E+00 0.00E+00 0.00E+00 0.00E+00 0.00E+00 0.00E+00 kg 0.00E+00 0.00E+00 0.00E+00 0.00E+00 0.00E+00 0.00E+00 0.00E+00 SM MJ 0.00E+00 0.00E+00 0.00E+00 0.00E+00 0.00E+00 0.00E+00 0.00E+00 RSF MJ 0.00E+00 0.00E+00 0.00E+00 0.00E+00 0.00E+00 0.00E+00 0.00E+00 NRSF m3 FW 1.93E+01 3.26E-01 2.88E+00 0.00E+00 1.29E+02 1.06E+02 4.48E-01 NRN Non-renewable Nuclear MJ 0.00E+00 0.00E+00 0.00E+00 0.00E+00 0.00E+00 0.00E+00 0.00E+00 TABLE 17: 8” DR 25 AWWA C900 OUTPUT FLOWS Disposal Stage C1-C4 Product Stage Construction Stage Use Stage Unit (per 1,000 ft) Parameter A1 A2 A3 A4 A5 B1-B7 Disposed-of Hazardous Waste Disposed-of Non- Hazardous Waste Disposed-of Radioactive Waste kg 0.00E+00 0.00E+00 6.85E-02 0.00E+00 0.00E+00 0.00E+00 0.00E+00 HWD kg 0.00E+00 0.00E+00 2.13E+01 0.00E+00 1.57E+03 0.00E+00 2.87E+04 NHWD kg 0.00E+00 0.00E+00 0.00E+00 0.00E+00 0.00E+00 0.00E+00 0.00E+00 RWD CRU Components for Reuse kg 0.00E+00 0.00E+00 0.00E+00 0.00E+00 0.00E+00 0.00E+00 0.00E+00 MFR Materials for Recycling kg 0.00E+00 0.00E+00 1.50E+01 0.00E+00 0.00E+00 0.00E+00 0.00E+00 Materials for Energy Recovery Exported Electrical Energy (Waste to Energy) Exported Thermal Energy (Waste to Energy) kg 0.00E+00 0.00E+00 0.00E+00 0.00E+00 0.00E+00 0.00E+00 0.00E+00 MET MJ 0.00E+00 0.00E+00 0.00E+00 0.00E+00 0.00E+00 0.00E+00 0.00E+00 EEE MJ 0.00E+00 0.00E+00 0.00E+00 0.00E+00 0.00E+00 0.00E+00 0.00E+00 EET BBPr Bio-Based Products kg CO2 eq 0.00E+00 0.00E+00 0.00E+00 0.00E+00 0.00E+00 0.00E+00 0.00E+00 BBPk Bio-Based Packaging kg CO2 eq -4.19E+01 0.00E+00 0.00E+00 0.00E+00 4.19E+01 0.00E+00 0.00E+00 EPD Program Operator NSF International 789 N. Dixboro Rd. Ann Arbor, MI 48105 USA www.nsfsustainability.org 21 Date of Issue: March 21, 2023 Period of Validity: 5 years Declaration#: EPD10047
ENVIRONMENTAL PRODUCT DECLARATION PRESSURE PIPE: 24” DR 25 AWWA C900 TABLE 18: 24” DR 25 AWWA C900 LIFE CYCLE IMPACT ASSESSMENT Disposal Stage Use Stage Product Stage Construction Stage Unit (per 1,000 ft) TRACI v2.1 A1 A2 A3 A4 A5 B1-B7 C1-C4 Global Warming Potential kg CO2 eq GWP 4.79E+04 1.56E+03 9.45E+03 9.28E+02 5.52E+03 6.76E+04 2.38E+02 Depletion Potential of the Stratospheric Ozone Layer kg CFC-11 eq 7.85E-03 2.51E-05 6.50E-04 3.54E-08 1.06E-04 5.22E-03 5.48E-05 ODP Acidification Potential kg SO2 eq AP 4.01E+02 2.13E+01 2.73E+01 5.54E+00 6.63E+01 1.71E+02 2.58E+00 Eutrophication Potential Photochemical Ozone Creation Potential kg N eq 2.05E+01 1.80E+00 3.54E+01 3.09E-01 6.32E+00 2.04E+02 3.01E-01 EP POCP kg O3 eq 2.06E+03 6.60E+02 3.90E+02 1.52E+02 2.00E+03 2.77E+03 6.54E+01 Disposal Stage Construction Stage Use Stage Product Stage Unit (per 1,000 ft) CML 2 Baseline 2001 A1 A2 A3 A4 A5 B1-B7 C1-C4 Global Warming Potential kg CO2 eq GWP 4.86E+04 1.56E+03 9.55E+03 9.30E+02 5.54E+03 6.81E+04 2.39E+02 Depletion Potential of the Stratospheric Ozone Layer kg CFC-11 eq 2.61E-03 2.32E-05 4.47E-04 3.50E-08 7.80E-05 3.53E-03 4.11E-05 ODP Acidification Potential kg SO2 eq AP 4.43E+02 1.64E+01 2.58E+01 4.57E+00 5.08E+01 1.53E+02 2.06E+00 Eutrophication Potential Photochemical Ozone Creation Potential Abiotic Depletion Potential for Fossil Resources kg PO4 eq EP 1.72E+01 3.73E+00 1.66E+01 8.10E-01 1.17E+01 9.94E+01 4.48E-01 POCP kg C2H4 eq 2.44E+01 4.15E-01 1.32E+00 2.11E-01 1.76E+00 7.90E+00 -2.08E-01 ADPF MJ 1.44E+06 2.15E+04 1.19E+05 1.19E+04 7.67E+04 8.84E+05 5.15E+03 EPD Program Operator NSF International 789 N. Dixboro Rd. Ann Arbor, MI 48105 USA www.nsfsustainability.org 22 Date of Issue: March 21, 2023 Period of Validity: 5 years Declaration#: EPD10047
ENVIRONMENTAL PRODUCT DECLARATION TABLE 19: 24” DR 25 AWWA C900 USE OF RESOURCES Disposal Stage C1-C4 Product Stage Construction Stage Use Stage Unit (per 1,000 ft) Use of Resources A1 A2 A3 A4 A5 B1-B7 Non-renewable Primary Resources Used as an Energy Carrier Renewable Primary Resources Used as an Energy Carrier Non-renewable Primary Resources with Energy Content Used as a Material Renewable Primary Resources with Energy Content Used as a Material Use of Secondary Materials Renewable Secondary Fuels Use of Non-renewable Secondary Fuels Fresh Water Consumption NRPRE MJ 1.01E+06 2.17E+04 1.77E+05 1.19E+04 7.99E+04 1.28E+06 5.18E+03 RPRE MJ 9.90E+03 1.50E+02 2.59E+04 0.00E+00 8.53E+02 1.21E+05 2.85E+01 NRPRM kg 4.37E+05 0.00E+00 0.00E+00 0.00E+00 0.00E+00 0.00E+00 0.00E+00 RPRM kg 2.72E+03 0.00E+00 0.00E+00 0.00E+00 0.00E+00 0.00E+00 0.00E+00 kg 0.00E+00 0.00E+00 0.00E+00 0.00E+00 0.00E+00 0.00E+00 0.00E+00 SM MJ 0.00E+00 0.00E+00 0.00E+00 0.00E+00 0.00E+00 0.00E+00 0.00E+00 RSF MJ 0.00E+00 0.00E+00 0.00E+00 0.00E+00 0.00E+00 0.00E+00 0.00E+00 NRSF m3 FW 1.54E+02 3.36E+00 4.42E+01 0.00E+00 2.71E+02 2.56E+02 3.76E+00 NRN Non-renewable Nuclear MJ 0.00E+00 0.00E+00 0.00E+00 0.00E+00 0.00E+00 0.00E+00 0.00E+00 TABLE 20: 24” DR 25 AWWA C900 OUTPUT FLOWS Disposal Stage C1-C4 Product Stage Construction Stage Use Stage Unit (per 1,000 ft) Parameter A1 A2 A3 A4 A5 B1-B7 Disposed-of Hazardous Waste Disposed-of Non- Hazardous Waste Disposed-of Radioactive Waste kg 0.00E+00 0.00E+00 5.74E-01 0.00E+00 0.00E+00 0.00E+00 0.00E+00 HWD kg 0.00E+00 0.00E+00 1.78E+02 0.00E+00 1.40E+03 0.00E+00 2.40E+04 NHWD kg 0.00E+00 0.00E+00 0.00E+00 0.00E+00 0.00E+00 0.00E+00 0.00E+00 RWD CRU Components for Reuse kg 0.00E+00 0.00E+00 0.00E+00 0.00E+00 0.00E+00 0.00E+00 0.00E+00 MFR Materials for Recycling kg 0.00E+00 0.00E+00 1.26E+02 0.00E+00 0.00E+00 0.00E+00 0.00E+00 Materials for Energy Recovery Exported Electrical Energy (Waste to Energy) Exported Thermal Energy (Waste to Energy) kg 0.00E+00 0.00E+00 0.00E+00 0.00E+00 0.00E+00 0.00E+00 0.00E+00 MET MJ 0.00E+00 0.00E+00 0.00E+00 0.00E+00 0.00E+00 0.00E+00 0.00E+00 EEE MJ 0.00E+00 0.00E+00 0.00E+00 0.00E+00 0.00E+00 0.00E+00 0.00E+00 EET BBPr Bio-Based Products kg CO2 eq 0.00E+00 0.00E+00 0.00E+00 0.00E+00 0.00E+00 0.00E+00 0.00E+00 BBPk Bio-Based Packaging kg CO2 eq -2.64E+02 0.00E+00 0.00E+00 0.00E+00 2.64E+02 0.00E+00 0.00E+00 EPD Program Operator NSF International 789 N. Dixboro Rd. Ann Arbor, MI 48105 USA www.nsfsustainability.org 23 Date of Issue: March 21, 2023 Period of Validity: 5 years Declaration#: EPD10047
ENVIRONMENTAL PRODUCT DECLARATION PRESSURE PIPE: 8” PC 235 AWWA C909 TABLE 21: 8” PC 235 AWWA C909 LIFE CYCLE IMPACT ASSESSMENT Disposal Stage Use Stage Product Stage Construction Stage Unit (per 1,000 ft) TRACI v2.1 A1 A2 A3 A4 A5 B1-B7 C1-C4 Global Warming Potential kg CO2 eq GWP 4.88E+03 1.20E+03 3.00E+02 1.76E+02 2.52E+03 2.84E+04 2.48E+01 Depletion Potential of the Stratospheric Ozone Layer kg CFC-11 eq 8.17E-04 6.87E-05 1.42E-05 6.73E-09 5.48E-05 2.19E-03 5.70E-06 ODP Acidification Potential kg SO2 eq AP 4.14E+01 5.15E+00 1.71E+00 1.05E+00 2.86E+01 7.18E+01 2.68E-01 Eutrophication Potential Photochemical Ozone Creation Potential kg N eq 1.61E+00 5.18E+00 3.75E-01 5.87E-02 3.17E+00 8.55E+01 3.12E-02 EP POCP kg O3 eq 2.09E+02 9.23E+01 2.40E+01 2.88E+01 8.42E+02 1.16E+03 6.79E+00 Disposal Stage Construction Stage Use Stage Product Stage Unit (per 1,000 ft) CML 2 Baseline 2001 A1 A2 A3 A4 A5 B1-B7 C1-C4 Global Warming Potential kg CO2 eq GWP 4.96E+03 1.21E+03 2.99E+02 1.77E+02 2.54E+03 2.86E+04 2.49E+01 Depletion Potential of the Stratospheric Ozone Layer kg CFC-11 eq 2.69E-04 4.83E-05 1.31E-05 6.67E-09 3.96E-05 1.48E-03 4.27E-06 ODP Acidification Potential kg SO2 eq AP 4.58E+01 4.75E+00 1.70E+00 8.69E-01 2.22E+01 6.44E+01 2.14E-01 Eutrophication Potential Photochemical Ozone Creation Potential Abiotic Depletion Potential for Fossil Resources kg PO4 eq EP 1.54E+00 2.59E+00 2.65E-01 1.54E-01 5.13E+00 4.17E+01 4.66E-02 POCP kg C2H4 eq 2.49E+00 2.00E-01 1.14E-01 4.01E-02 7.78E-01 3.32E+00 -2.16E-02 ADPF MJ 1.50E+05 1.48E+04 4.79E+03 2.27E+03 3.39E+04 3.71E+05 5.35E+02 EPD Program Operator NSF International 789 N. Dixboro Rd. Ann Arbor, MI 48105 USA www.nsfsustainability.org 24 Date of Issue: March 21, 2023 Period of Validity: 5 years Declaration#: EPD10047
ENVIRONMENTAL PRODUCT DECLARATION TABLE 22: 8” PC 235 AWWA C909 USE OF RESOURCES Disposal Stage C1-C4 Product Stage Construction Stage Use Stage Unit (per 1,000 ft) Use of Resources A1 A2 A3 A4 A5 B1-B7 Non-renewable Primary Resources Used as an Energy Carrier Renewable Primary Resources Used as an Energy Carrier Non-renewable Primary Resources with Energy Content Used as a Material Renewable Primary Resources with Energy Content Used as a Material Use of Secondary Materials Renewable Secondary Fuels Use of Non-renewable Secondary Fuels Fresh Water Consumption NRPRE MJ 1.48E+05 2.30E+04 4.69E+03 2.27E+03 3.62E+04 5.37E+05 5.39E+02 RPRE MJ 5.05E+02 5.52E+03 8.60E+01 0.00E+00 4.81E+02 5.10E+04 2.96E+00 NRPRM kg 2.50E+03 0.00E+00 2.11E+02 0.00E+00 0.00E+00 0.00E+00 0.00E+00 RPRM kg 1.17E+02 0.00E+00 0.00E+00 0.00E+00 0.00E+00 0.00E+00 0.00E+00 kg 0.00E+00 0.00E+00 0.00E+00 0.00E+00 0.00E+00 0.00E+00 0.00E+00 SM MJ 0.00E+00 0.00E+00 0.00E+00 0.00E+00 0.00E+00 0.00E+00 0.00E+00 RSF MJ 0.00E+00 0.00E+00 0.00E+00 0.00E+00 0.00E+00 0.00E+00 0.00E+00 NRSF m3 FW 1.48E+01 6.36E+00 1.91E+00 0.00E+00 2.34E+02 1.07E+02 3.91E-01 NRN Non-renewable Nuclear MJ 0.00E+00 0.00E+00 0.00E+00 0.00E+00 0.00E+00 0.00E+00 0.00E+00 TABLE 23: 8” PC 235 AWWA C909 OUTPUT FLOWS Disposal Stage C1-C4 Product Stage Construction Stage Use Stage Unit (per 1,000 ft) Parameter A1 A2 A3 A4 A5 B1-B7 Disposed-of Hazardous Waste Disposed-of Non- Hazardous Waste Disposed-of Radioactive Waste kg 0.00E+00 0.00E+00 5.97E-02 0.00E+00 0.00E+00 0.00E+00 0.00E+00 HWD kg 0.00E+00 0.00E+00 1.85E+01 0.00E+00 5.13E+02 0.00E+00 2.50E+03 NHWD kg 0.00E+00 0.00E+00 0.00E+00 0.00E+00 0.00E+00 0.00E+00 0.00E+00 RWD CRU Components for Reuse kg 0.00E+00 0.00E+00 0.00E+00 0.00E+00 0.00E+00 0.00E+00 0.00E+00 MFR Materials for Recycling kg 0.00E+00 0.00E+00 1.31E+01 0.00E+00 0.00E+00 0.00E+00 0.00E+00 Materials for Energy Recovery Exported Electrical Energy (Waste to Energy) Exported Thermal Energy (Waste to Energy) kg 0.00E+00 0.00E+00 0.00E+00 0.00E+00 0.00E+00 0.00E+00 0.00E+00 MET MJ 0.00E+00 0.00E+00 0.00E+00 0.00E+00 0.00E+00 0.00E+00 0.00E+00 EEE MJ 0.00E+00 0.00E+00 0.00E+00 0.00E+00 0.00E+00 0.00E+00 0.00E+00 EET BBPr Bio-Based Products kg CO2 eq 0.00E+00 0.00E+00 0.00E+00 0.00E+00 0.00E+00 0.00E+00 0.00E+00 BBPk Bio-Based Packaging kg CO2 eq -5.79E+01 0.00E+00 0.00E+00 0.00E+00 5.79E+01 0.00E+00 0.00E+00 EPD Program Operator NSF International 789 N. Dixboro Rd. Ann Arbor, MI 48105 USA www.nsfsustainability.org 25 Date of Issue: March 21, 2023 Period of Validity: 5 years Declaration#: EPD10047
ENVIRONMENTAL PRODUCT DECLARATION STORM WATER PIPE: 24” PS 46 ASTM F794 / AASHTO M304 (PROFILE WALL) PVC PIPE TABLE 24: 24” PS 46 ASTM F794 / AASHTO M304 (PROFILE WALL) LIFE CYCLE IMPACT ASSESSMENT Disposal Stage Use Stage Product Stage Construction Stage Unit (per 1,000 ft) TRACI v2.1 A1 A2 A3 A4 A5 B1-B7 C1-C4 Global Warming Potential kg CO2 eq GWP 2.58E+04 1.66E+03 3.13E+03 8.09E+02 5.46E+03 0.00E+00 7.28E+01 Depletion Potential of the Stratospheric Ozone Layer kg CFC-11 eq 4.26E-03 2.02E-06 2.02E-04 3.09E-08 1.04E-04 0.00E+00 3.24E-05 ODP Acidification Potential kg SO2 eq AP 2.17E+02 2.14E+01 9.22E+00 4.83E+00 6.60E+01 0.00E+00 6.25E-01 Eutrophication Potential Photochemical Ozone Creation Potential kg N eq 8.10E+00 1.29E+00 1.16E+01 2.69E-01 6.22E+00 0.00E+00 1.24E-01 EP POCP kg O3 eq 1.10E+03 6.61E+02 1.60E+02 1.32E+02 2.00E+03 0.00E+00 1.55E+01 Disposal Stage Construction Stage Use Stage Product Stage Unit (per 1,000 ft) CML 2 Baseline 2001 A1 A2 A3 A4 A5 B1-B7 C1-C4 Global Warming Potential kg CO2 eq GWP 2.62E+04 1.67E+03 3.17E+03 8.12E+02 5.49E+03 0.00E+00 7.30E+01 Depletion Potential of the Stratospheric Ozone Layer kg CFC-11 eq 1.39E-03 1.82E-06 1.39E-04 3.06E-08 7.64E-05 0.00E+00 2.43E-05 ODP Acidification Potential kg SO2 eq AP 2.40E+02 1.66E+01 8.38E+00 3.99E+00 5.06E+01 0.00E+00 5.32E-01 Eutrophication Potential Photochemical Ozone Creation Potential Abiotic Depletion Potential for Fossil Resources kg PO4 eq EP 8.03E+00 3.51E+00 5.59E+00 7.06E-01 1.16E+01 0.00E+00 1.15E-01 POCP kg C2H4 eq 1.30E+01 4.37E-01 4.38E-01 1.84E-01 1.73E+00 0.00E+00 2.18E-02 ADPF MJ 7.93E+05 2.17E+04 3.90E+04 1.04E+04 7.60E+04 0.00E+00 2.07E+03 EPD Program Operator NSF International 789 N. Dixboro Rd. Ann Arbor, MI 48105 USA www.nsfsustainability.org 26 Date of Issue: March 21, 2023 Period of Validity: 5 years Declaration#: EPD10047
ENVIRONMENTAL PRODUCT DECLARATION TABLE 25: 24” PS 46 ASTM F794 / AASHTO M304 (PROFILE WALL) USE OF RESOURCES Disposal Stage C1-C4 Product Stage Construction Stage Use Stage Unit (per 1,000 ft) Use of Resources A1 A2 A3 A4 A5 B1-B7 Non-renewable Primary Resources Used as an Energy Carrier Renewable Primary Resources Used as an Energy Carrier Non-renewable Primary Resources with Energy Content Used as a Material Renewable Primary Resources with Energy Content Used as a Material Use of Secondary Materials Renewable Secondary Fuels Use of Non-renewable Secondary Fuels Fresh Water Consumption NRPRE MJ 5.52E+05 2.18E+04 5.78E+04 1.04E+04 7.91E+04 0.00E+00 2.09E+03 RPRE MJ 2.08E+03 1.34E+02 4.68E+03 0.00E+00 7.98E+02 0.00E+00 1.68E+01 NRPRM kg 2.43E+05 0.00E+00 0.00E+00 0.00E+00 0.00E+00 0.00E+00 0.00E+00 RPRM kg 6.59E+03 0.00E+00 0.00E+00 0.00E+00 0.00E+00 0.00E+00 0.00E+00 kg 0.00E+00 0.00E+00 0.00E+00 0.00E+00 0.00E+00 0.00E+00 0.00E+00 SM MJ 0.00E+00 0.00E+00 0.00E+00 0.00E+00 0.00E+00 0.00E+00 0.00E+00 RSF MJ 0.00E+00 0.00E+00 0.00E+00 0.00E+00 0.00E+00 0.00E+00 0.00E+00 NRSF m3 FW 8.95E+01 2.60E-01 1.37E+01 0.00E+00 1.52E+02 0.00E+00 2.22E+00 NRN Non-renewable Nuclear MJ 0.00E+00 0.00E+00 0.00E+00 0.00E+00 0.00E+00 0.00E+00 0.00E+00 TABLE 26: 24” PS 46 ASTM F794 / AASHTO M304 (PROFILE WALL) OUTPUT FLOWS Disposal Stage C1-C4 Product Stage Construction Stage Use Stage Unit (per 1,000 ft) Parameter A1 A2 A3 A4 A5 B1-B7 Disposed-of Hazardous Waste Disposed-of Non- Hazardous Waste Disposed-of Radioactive Waste kg 0.00E+00 0.00E+00 3.40E-01 0.00E+00 0.00E+00 0.00E+00 0.00E+00 HWD kg 0.00E+00 0.00E+00 1.05E+02 0.00E+00 1.07E+03 0.00E+00 1.42E+04 NHWD kg 0.00E+00 0.00E+00 0.00E+00 0.00E+00 0.00E+00 0.00E+00 0.00E+00 RWD CRU Components for Reuse kg 0.00E+00 0.00E+00 0.00E+00 0.00E+00 0.00E+00 0.00E+00 0.00E+00 MFR Materials for Recycling kg 0.00E+00 0.00E+00 7.44E+01 0.00E+00 0.00E+00 0.00E+00 0.00E+00 Materials for Energy Recovery Exported Electrical Energy (Waste to Energy) Exported Thermal Energy (Waste to Energy) kg 0.00E+00 0.00E+00 0.00E+00 0.00E+00 0.00E+00 0.00E+00 0.00E+00 MET MJ 0.00E+00 0.00E+00 0.00E+00 0.00E+00 0.00E+00 0.00E+00 0.00E+00 EEE MJ 0.00E+00 0.00E+00 0.00E+00 0.00E+00 0.00E+00 0.00E+00 0.00E+00 EET BBPr Bio-Based Products kg CO2 eq 0.00E+00 0.00E+00 0.00E+00 0.00E+00 0.00E+00 0.00E+00 0.00E+00 BBPk Bio-Based Packaging kg CO2 eq -3.50E+02 0.00E+00 0.00E+00 0.00E+00 3.50E+02 0.00E+00 0.00E+00 EPD Program Operator NSF International 789 N. Dixboro Rd. Ann Arbor, MI 48105 USA www.nsfsustainability.org 27 Date of Issue: March 21, 2023 Period of Validity: 5 years Declaration#: EPD10047
ENVIRONMENTAL PRODUCT DECLARATION SANITARY SEWER PIPE: 8” PS 46 ASTM F794 (PROFILE WALL) PVC PIPE TABLE 27: 8” PS 46 ASTM F794 (PROFILE WALL) LIFE CYCLE IMPACT ASSESSMENT Disposal Stage Use Stage Product Stage Construction Stage Unit (per 1,000 ft) TRACI v2.1 A1 A2 A3 A4 A5 B1-B7 C1-C4 Global Warming Potential kg CO2 eq GWP 2.20E+03 2.06E+02 2.64E+02 8.09E+02 5.46E+03 0.00E+00 7.28E+01 Depletion Potential of the Stratospheric Ozone Layer kg CFC-11 eq 3.67E-04 1.83E-07 1.67E-05 3.09E-08 1.04E-04 0.00E+00 3.24E-05 ODP Acidification Potential kg SO2 eq AP 1.86E+01 2.15E+00 8.01E-01 4.83E+00 6.60E+01 0.00E+00 6.25E-01 Eutrophication Potential Photochemical Ozone Creation Potential kg N eq 6.57E-01 1.31E-01 1.03E+00 2.69E-01 6.22E+00 0.00E+00 1.24E-01 EP POCP kg O3 eq 9.39E+01 6.46E+01 1.33E+01 1.32E+02 2.00E+03 0.00E+00 1.55E+01 Disposal Stage Construction Stage Use Stage Product Stage Unit (per 1,000 ft) CML 2 Baseline 2001 A1 A2 A3 A4 A5 B1-B7 C1-C4 Global Warming Potential kg CO2 eq GWP 2.24E+03 2.07E+02 2.68E+02 8.12E+02 5.49E+03 0.00E+00 7.30E+01 Depletion Potential of the Stratospheric Ozone Layer kg CFC-11 eq 1.20E-04 1.58E-07 1.15E-05 3.06E-08 7.64E-05 0.00E+00 2.43E-05 ODP Acidification Potential kg SO2 eq AP 2.06E+01 1.69E+00 7.40E-01 3.99E+00 5.06E+01 0.00E+00 5.32E-01 Eutrophication Potential Photochemical Ozone Creation Potential Abiotic Depletion Potential for Fossil Resources kg PO4 eq EP 6.69E-01 3.45E-01 4.91E-01 7.06E-01 1.16E+01 0.00E+00 1.15E-01 POCP kg C2H4 eq 1.12E+00 5.18E-02 3.83E-02 1.84E-01 1.73E+00 0.00E+00 2.18E-02 ADPF MJ 6.81E+04 2.70E+03 3.27E+03 1.04E+04 7.60E+04 0.00E+00 2.07E+03 EPD Program Operator NSF International 789 N. Dixboro Rd. Ann Arbor, MI 48105 USA www.nsfsustainability.org 28 Date of Issue: March 21, 2023 Period of Validity: 5 years Declaration#: EPD10047
ENVIRONMENTAL PRODUCT DECLARATION TABLE 28: 8” PS 46 ASTM F794 (PROFILE WALL) USE OF RESOURCES Disposal Stage C1-C4 Product Stage Construction Stage Use Stage Unit (per 1,000 ft) Use of Resources A1 A2 A3 A4 A5 B1-B7 Non-renewable Primary Resources Used as an Energy Carrier Renewable Primary Resources Used as an Energy Carrier Non-renewable Primary Resources with Energy Content Used as a Material Renewable Primary Resources with Energy Content Used as a Material Use of Secondary Materials Renewable Secondary Fuels Use of Non-renewable Secondary Fuels Fresh Water Consumption NRPRE MJ 4.75E+04 2.71E+03 4.84E+03 9.46E+02 3.56E+04 0.00E+00 2.65E+02 RPRE MJ 6.98E+02 3.54E+01 0.00E+00 0.00E+00 4.27E+02 0.00E+00 1.45E+00 NRPRM kg 2.08E+04 0.00E+00 0.00E+00 0.00E+00 0.00E+00 0.00E+00 0.00E+00 RPRM kg 0.00E+00 0.00E+00 0.00E+00 0.00E+00 0.00E+00 0.00E+00 0.00E+00 kg 0.00E+00 0.00E+00 0.00E+00 0.00E+00 0.00E+00 0.00E+00 0.00E+00 SM MJ 0.00E+00 0.00E+00 0.00E+00 0.00E+00 0.00E+00 0.00E+00 0.00E+00 RSF MJ 0.00E+00 0.00E+00 0.00E+00 0.00E+00 0.00E+00 0.00E+00 0.00E+00 NRSF m3 FW 7.18E+00 2.13E-02 1.18E+00 0.00E+00 1.15E+02 0.00E+00 1.92E-01 NRN Non-renewable Nuclear MJ 0.00E+00 0.00E+00 0.00E+00 0.00E+00 0.00E+00 0.00E+00 0.00E+00 TABLE 29: 8” PS 46 ASTM F794 (PROFILE WALL) OUTPUT FLOWS Disposal Stage C1-C4 Product Stage Construction Stage Use Stage Unit (per 1,000 ft) Parameter A1 A2 A3 A4 A5 B1-B7 Disposed-of Hazardous Waste Disposed-of Non- Hazardous Waste Disposed-of Radioactive Waste kg 0.00E+00 0.00E+00 2.94E-02 0.00E+00 0.00E+00 0.00E+00 0.00E+00 HWD kg 0.00E+00 0.00E+00 9.11E+00 0.00E+00 9.12E+01 0.00E+00 1.23E+03 NHWD kg 0.00E+00 0.00E+00 0.00E+00 0.00E+00 0.00E+00 0.00E+00 0.00E+00 RWD CRU Components for Reuse kg 0.00E+00 0.00E+00 0.00E+00 0.00E+00 0.00E+00 0.00E+00 0.00E+00 MFR Materials for Recycling kg 0.00E+00 0.00E+00 6.43E+00 0.00E+00 0.00E+00 0.00E+00 0.00E+00 Materials for Energy Recovery Exported Electrical Energy (Waste to Energy) Exported Thermal Energy (Waste to Energy) kg 0.00E+00 0.00E+00 0.00E+00 0.00E+00 0.00E+00 0.00E+00 0.00E+00 MET MJ 0.00E+00 0.00E+00 0.00E+00 0.00E+00 0.00E+00 0.00E+00 0.00E+00 EEE MJ 0.00E+00 0.00E+00 0.00E+00 0.00E+00 0.00E+00 0.00E+00 0.00E+00 EET BBPr Bio-Based Products kg CO2 eq 0.00E+00 0.00E+00 0.00E+00 0.00E+00 0.00E+00 0.00E+00 0.00E+00 BBPk Bio-Based Packaging kg CO2 eq -2.79E+01 0.00E+00 0.00E+00 0.00E+00 2.79E+01 0.00E+00 0.00E+00 EPD Program Operator NSF International 789 N. Dixboro Rd. Ann Arbor, MI 48105 USA www.nsfsustainability.org 29 Date of Issue: March 21, 2023 Period of Validity: 5 years Declaration#: EPD10047
ENVIRONMENTAL PRODUCT DECLARATION SANITARY SEWER PIPE: 8” DR 35 ASTM D3034 (SOLID WALL) PVC PIPE TABLE 30: 8” DR 35 ASTM D3034 (SOLID WALL) LIFE CYCLE IMPACT ASSESSMENT Disposal Stage Use Stage Product Stage Construction Stage Unit (per 1,000 ft) TRACI v2.1 A1 A2 A3 A4 A5 B1-B7 C1-C4 Global Warming Potential kg CO2 eq GWP 3.71E+03 1.30E+02 4.71E+02 8.45E+01 2.48E+03 0.00E+00 1.90E+00 Depletion Potential of the Stratospheric Ozone Layer kg CFC-11 eq 5.58E-04 8.02E-07 3.37E-05 3.22E-09 5.29E-05 0.00E+00 4.38E-07 ODP Acidification Potential kg SO2 eq AP 2.89E+01 1.82E+00 1.28E+00 5.05E-01 2.85E+01 0.00E+00 2.06E-02 Eutrophication Potential Photochemical Ozone Creation Potential kg N eq 2.85E+00 1.23E-01 1.63E+00 2.81E-02 3.08E+00 0.00E+00 2.40E-03 EP POCP kg O3 eq 1.54E+02 5.68E+01 2.00E+01 1.38E+01 8.40E+02 0.00E+00 5.22E-01 Disposal Stage Construction Stage Use Stage Product Stage Unit (per 1,000 ft) CML 2 Baseline 2001 A1 A2 A3 A4 A5 B1-B7 C1-C4 Global Warming Potential kg CO2 eq GWP 3.76E+03 1.30E+02 4.75E+02 8.48E+01 2.49E+03 0.00E+00 1.91E+00 Depletion Potential of the Stratospheric Ozone Layer kg CFC-11 eq 1.89E-04 7.40E-07 2.30E-05 3.19E-09 3.83E-05 0.00E+00 3.28E-07 ODP Acidification Potential kg SO2 eq AP 3.18E+01 1.40E+00 1.18E+00 4.17E-01 2.20E+01 0.00E+00 1.65E-02 Eutrophication Potential Photochemical Ozone Creation Potential Abiotic Depletion Potential for Fossil Resources kg PO4 eq EP 1.90E+00 3.07E-01 7.79E-01 7.38E-02 5.09E+00 0.00E+00 3.58E-03 POCP kg C2H4 eq 1.88E+00 3.41E-02 6.13E-02 1.92E-02 7.65E-01 0.00E+00 -1.66E-03 ADPF MJ 1.02E+05 1.74E+03 6.01E+03 1.09E+03 3.35E+04 0.00E+00 4.11E+01 EPD Program Operator NSF International 789 N. Dixboro Rd. Ann Arbor, MI 48105 USA www.nsfsustainability.org 30 Date of Issue: March 21, 2023 Period of Validity: 5 years Declaration#: EPD10047
ENVIRONMENTAL PRODUCT DECLARATION TABLE 31: 8” DR 35 ASTM D3034 (SOLID WALL) USE OF RESOURCES Disposal Stage C1-C4 Product Stage Construction Stage Use Stage Unit (per 1,000 ft) Use of Resources A1 A2 A3 A4 A5 B1-B7 Non-renewable Primary Resources Used as an Energy Carrier Renewable Primary Resources Used as an Energy Carrier Non-renewable Primary Resources with Energy Content Used as a Material Renewable Primary Resources with Energy Content Used as a Material Use of Secondary Materials Renewable Secondary Fuels Use of Non-renewable Secondary Fuels Fresh Water Consumption NRPRE MJ 8.10E+04 1.74E+03 5.25E+01 1.09E+03 3.56E+04 0.00E+00 4.14E+01 RPRE MJ 3.70E+03 4.50E+00 0.00E+00 0.00E+00 4.27E+02 0.00E+00 2.27E-01 NRPRM kg 3.08E+04 0.00E+00 0.00E+00 0.00E+00 0.00E+00 0.00E+00 0.00E+00 RPRM kg 0.00E+00 0.00E+00 0.00E+00 0.00E+00 0.00E+00 0.00E+00 0.00E+00 kg 0.00E+00 0.00E+00 0.00E+00 0.00E+00 0.00E+00 0.00E+00 0.00E+00 SM MJ 0.00E+00 0.00E+00 0.00E+00 0.00E+00 0.00E+00 0.00E+00 0.00E+00 RSF MJ 0.00E+00 0.00E+00 0.00E+00 0.00E+00 0.00E+00 0.00E+00 0.00E+00 NRSF m3 FW 1.61E+01 1.06E-01 1.24E+00 0.00E+00 1.15E+02 0.00E+00 3.00E-02 NRN Non-renewable Nuclear MJ 0.00E+00 0.00E+00 0.00E+00 0.00E+00 0.00E+00 0.00E+00 0.00E+00 TABLE 32: 8” DR 35 ASTM D3034 (SOLID WALL) OUTPUT FLOWS Disposal Stage C1-C4 Product Stage Construction Stage Use Stage Unit (per 1,000 ft) Parameter A1 A2 A3 A4 A5 B1-B7 Disposed-of Hazardous Waste Disposed-of Non- Hazardous Waste Disposed-of Radioactive Waste kg 0.00E+00 0.00E+00 4.59E-02 0.00E+00 0.00E+00 0.00E+00 0.00E+00 HWD kg 0.00E+00 0.00E+00 1.42E+01 0.00E+00 1.15E+02 0.00E+00 1.92E+03 NHWD kg 0.00E+00 0.00E+00 0.00E+00 0.00E+00 0.00E+00 0.00E+00 0.00E+00 RWD CRU Components for Reuse kg 0.00E+00 0.00E+00 0.00E+00 0.00E+00 0.00E+00 0.00E+00 0.00E+00 MFR Materials for Recycling kg 0.00E+00 0.00E+00 1.00E+01 0.00E+00 0.00E+00 0.00E+00 0.00E+00 Materials for Energy Recovery Exported Electrical Energy (Waste to Energy) Exported Thermal Energy (Waste to Energy) kg 0.00E+00 0.00E+00 0.00E+00 0.00E+00 0.00E+00 0.00E+00 0.00E+00 MET MJ 0.00E+00 0.00E+00 0.00E+00 0.00E+00 0.00E+00 0.00E+00 0.00E+00 EEE MJ 0.00E+00 0.00E+00 0.00E+00 0.00E+00 0.00E+00 0.00E+00 0.00E+00 EET BBPr Bio-Based Products kg CO2 eq 0.00E+00 0.00E+00 0.00E+00 0.00E+00 0.00E+00 0.00E+00 0.00E+00 BBPk Bio-Based Packaging kg CO2 eq -1.71E+01 0.00E+00 0.00E+00 0.00E+00 1.71E+01 0.00E+00 0.00E+00 EPD Program Operator NSF International 789 N. Dixboro Rd. Ann Arbor, MI 48105 USA www.nsfsustainability.org 31 Date of Issue: March 21, 2023 Period of Validity: 5 years Declaration#: EPD10047
ENVIRONMENTAL PRODUCT DECLARATION SANITARY SEWER PIPE: 24” PS 46 ASTM F679 (SOLID WALL) PVC PIPE TABLE 33: 24” PS 46 ASTM F679 (SOLID WALL) LIFE CYCLE IMPACT ASSESSMENT Disposal Stage Use Stage Product Stage Construction Stage Unit (per 1,000 ft) TRACI v2.1 A1 A2 A3 A4 A5 B1-B7 C1-C4 Global Warming Potential kg CO2 eq GWP 2.79E+04 6.22E+02 3.30E+03 3.98E+02 6.08E+03 0.00E+00 8.40E+01 Depletion Potential of the Stratospheric Ozone Layer kg CFC-11 eq 4.55E-03 2.37E-08 2.40E-04 1.52E-08 2.44E-04 0.00E+00 3.67E-05 ODP Acidification Potential kg SO2 eq AP 2.33E+02 8.55E+00 9.25E+00 2.38E+00 7.20E+01 0.00E+00 7.18E-01 Eutrophication Potential Photochemical Ozone Creation Potential kg N eq 1.15E+01 5.13E-01 1.12E+01 1.33E-01 6.90E+00 0.00E+00 1.40E-01 EP POCP kg O3 eq 1.20E+03 2.72E+02 1.36E+02 6.51E+01 2.18E+03 0.00E+00 1.78E+01 Disposal Stage Construction Stage Use Stage Product Stage Unit (per 1,000 ft) CML 2 Baseline 2001 A1 A2 A3 A4 A5 B1-B7 C1-C4 Global Warming Potential kg CO2 eq GWP 2.83E+04 6.23E+02 3.34E+03 3.99E+02 6.11E+03 0.00E+00 8.43E+01 Depletion Potential of the Stratospheric Ozone Layer kg CFC-11 eq 1.52E-03 2.35E-08 1.64E-04 1.50E-08 1.82E-04 0.00E+00 2.76E-05 ODP Acidification Potential kg SO2 eq AP 2.58E+02 6.53E+00 8.66E+00 1.96E+00 5.52E+01 0.00E+00 6.12E-01 Eutrophication Potential Photochemical Ozone Creation Potential Abiotic Depletion Potential for Fossil Resources kg PO4 eq EP 9.87E+00 1.44E+00 5.34E+00 3.48E-01 1.27E+01 0.00E+00 1.31E-01 POCP kg C2H4 eq 1.42E+01 1.51E-01 4.48E-01 9.05E-02 1.84E+00 0.00E+00 2.56E-02 ADPF MJ 8.45E+05 8.01E+03 4.24E+04 5.12E+03 8.45E+04 0.00E+00 2.38E+03 EPD Program Operator NSF International 789 N. Dixboro Rd. Ann Arbor, MI 48105 USA www.nsfsustainability.org 32 Date of Issue: March 21, 2023 Period of Validity: 5 years Declaration#: EPD10047
ENVIRONMENTAL PRODUCT DECLARATION TABLE 34: 24” PS 46 ASTM F679 (SOLID WALL) USE OF RESOURCES Disposal Stage C1-C4 Product Stage Construction Stage Use Stage Unit (per 1,000 ft) Use of Resources A1 A2 A3 A4 A5 B1-B7 Non-renewable Primary Resources Used as an Energy Carrier Renewable Primary Resources Used as an Energy Carrier Non-renewable Primary Resources with Energy Content Used as a Material Renewable Primary Resources with Energy Content Used as a Material Use of Secondary Materials Renewable Secondary Fuels Use of Non-renewable Secondary Fuels Fresh Water Consumption NRPRE MJ 8.83E+05 8.49E+03 6.57E+04 5.43E+03 9.30E+04 0.00E+00 2.55E+03 RPRE MJ 1.02E+03 0.00E+00 6.22E+03 0.00E+00 6.50E+02 0.00E+00 1.39E+01 NRPRM kg 2.79E+05 0.00E+00 0.00E+00 0.00E+00 0.00E+00 0.00E+00 0.00E+00 RPRM kg 1.12E+04 0.00E+00 1.82E+03 0.00E+00 2.11E+02 0.00E+00 7.03E+00 kg 0.00E+00 0.00E+00 0.00E+00 0.00E+00 0.00E+00 0.00E+00 0.00E+00 SM MJ 0.00E+00 0.00E+00 0.00E+00 0.00E+00 0.00E+00 0.00E+00 0.00E+00 RSF MJ 0.00E+00 0.00E+00 0.00E+00 0.00E+00 0.00E+00 0.00E+00 0.00E+00 NRSF m3 FW 1.21E+02 0.00E+00 1.49E+01 0.00E+00 1.53E+02 0.00E+00 2.56E+00 NRN Non-renewable Nuclear MJ 0.00E+00 0.00E+00 0.00E+00 0.00E+00 0.00E+00 0.00E+00 0.00E+00 TABLE 35: 24” PS 46 ASTM F679 (SOLID WALL) OUTPUT FLOWS Disposal Stage C1-C4 Product Stage Construction Stage Use Stage Unit (per 1,000 ft) Parameter A1 A2 A3 A4 A5 B1-B7 Disposed-of Hazardous Waste Disposed-of Non- Hazardous Waste Disposed-of Radioactive Waste kg 2.08E-02 0.00E+00 1.20E-02 0.00E+00 5.75E-02 0.00E+00 3.64E-03 HWD kg 4.53E+02 0.00E+00 2.57E+02 0.00E+00 3.11E+02 0.00E+00 1.63E+04 NHWD kg 0.00E+00 0.00E+00 0.00E+00 0.00E+00 0.00E+00 0.00E+00 0.00E+00 RWD CRU Components for Reuse kg 0.00E+00 0.00E+00 0.00E+00 0.00E+00 0.00E+00 0.00E+00 0.00E+00 MFR Materials for Recycling kg 0.00E+00 0.00E+00 8.78E+01 0.00E+00 0.00E+00 0.00E+00 0.00E+00 Materials for Energy Recovery Exported Electrical Energy (Waste to Energy) Exported Thermal Energy (Waste to Energy) kg 0.00E+00 0.00E+00 0.00E+00 0.00E+00 0.00E+00 0.00E+00 0.00E+00 MET MJ 0.00E+00 0.00E+00 0.00E+00 0.00E+00 0.00E+00 0.00E+00 0.00E+00 EEE MJ 0.00E+00 0.00E+00 0.00E+00 0.00E+00 0.00E+00 0.00E+00 0.00E+00 EET BBPr Bio-Based Products kg 0.00E+00 0.00E+00 0.00E+00 0.00E+00 0.00E+00 0.00E+00 0.00E+00 BBPk Bio-Based Packaging kg -6.37E+00 0.00E+00 0.00E+00 0.00E+00 6.37E+00 0.00E+00 0.00E+00 EPD Program Operator NSF International 789 N. Dixboro Rd. Ann Arbor, MI 48105 USA www.nsfsustainability.org 33 Date of Issue: March 21, 2023 Period of Validity: 5 years Declaration#: EPD10047
ENVIRONMENTAL PRODUCT DECLARATION CONTACT INFORMATION Practitioner: This EPD and corresponding LCA were prepared by Sustainable Solutions Corporation of Royersford, Pennsylvania. To contact, please reach out at www.sustainablesolutionscorporation.com/contact-us. Association Description: PVCPA is the owner of this declaration. Their mission is to promote use of longer-life, lower-maintenance, corrosion-proof PVC piping in water and wastewater systems – for real sustainability, strength and long-term asset management. For more information, please reach out at info@unibell.org. EPD Program Operator NSF International 789 N. Dixboro Rd. Ann Arbor, MI 48105 USA www.nsfsustainability.org 34 Date of Issue: March 21, 2023 Period of Validity: 5 years Declaration#: EPD10047
ENVIRONMENTAL PRODUCT DECLARATION REFERENCES Note: clickable links are blue and underlined. The following references were used in the publication of this EPD: 1. AASHTO M304 Standard Specification for Poly(Vinyl Chloride) (PVC) Profile Wall Drain Pipe and Fittings Based on Controlled Inside Diameter. 2011. 2. ASTM D1784 Standard Classification System and Basis for Specification for Rigid Poly(Vinyl Chloride) (PVC) Compounds and Chlorinated Poly(Vinyl Chloride) (CPVC) Compounds. 2020. 3. ASTM D2837 Standard Test Method for Obtaining Hydrostatic Design Basis for Thermoplastic Pipe Materials or Pressure Design Basis for Thermoplastic Pipe Products. 2022. 4. ASTM D3034 Standard Specification for Type PSM Poly(Vinyl Chloride) (PVC) Sewer Pipe and Fittings. 2021. 5. ASTM F477 Standard Specification for Elastomeric Seals (Gaskets) for Joining Plastic Pipe. 2021. 6. ASTM F679 Standard Specification for Poly(Vinyl Chloride) (PVC) Large-Diameter Plastic Gravity Sewer Pipe and Fittings. 2021. 7. ASTM F794 Standard Specification for Poly(Vinyl Chloride) (PVC) Profile Gravity Sewer Pipe and Fittings Based on Controlled Inside Diameter. 2021. 8. AWWA C900 Polyvinyl Chloride (PVC) Pressure Pipe and Fabricated Fittings, 4 in. through 60 in. (100 mm Through 1,500 mm). 2022. 9. AWWA C909 Molecularly Oriented Polyvinyl Chloride (PVCO) Pressure Pipe, 4 in. (100 mm) and Larger. 2022. 10. Burn, S. et. al., “Long-term Performance Prediction for PVC Pipes,” AWWARF Report 91092F, May 2006. 11. Folkman, Steven. PVC Pipe Longevity Report: Affordability & the 100+ Year Benchmark Standard. Utah State University Buried Structures Laboratory. May 2014. 12. Forum on Forestry Forum. https://www.forestryforum.com/board/index.php?topic=14063.0. Accessed March 2013. 13. Forum on Heavy Equipment. https://www.heavyequipmentforums.com/showthread.php?5804-Fuel-Consumption. Accessed March 2013. 14. Handbook of PVC Pipe: Design and Construction. Fifth Edition. Uni-Bell. (2012). p. 9.7. 15. ISO 14025:2006-10, Environmental Labelling and Declarations - Type III — Environmental Declarations — Principles and Procedures (ISO 14025:2006); English version. 16. ISO 14040:2006-10, Environmental management - Life cycle assessment - Principles and framework (ISO 14040:2006); English version EN ISO 14040:2006. 17. ISO 14044:2006-10, Environmental management - Life cycle assessment - requirements and guidelines (ISO 14044:2006); English version EN ISO 14044:2006. 18. ISO 21930:2017 Sustainability in Building Construction — Environmental Declaration of Building Products 19. NSF Standard 61 Drinking Water System Components. 2021. 20. SI Metric. Density of Dry Material Table. https://www.simetric.co.uk/si_materials.htm. Accessed September 25, 2013. 21. SimaPro v9.2 Multi user. PRé Consultants. 2021. 22. UL 1285 Pipe and Couplings, Polyvinyl Chloride (PVC), and Oriented Polyvinyl Chloride (PVCO) for Underground Fire Service. 2022. 23. US LCI Database for Life Cycle Engineering, National Renewable Energy Laboratory, Lakewood, CO. 2008. EPD Program Operator NSF International 789 N. Dixboro Rd. Ann Arbor, MI 48105 USA www.nsfsustainability.org 35 Date of Issue: March 21, 2023 Period of Validity: 5 years Declaration#: EPD10047
ENVIRONMENTAL PRODUCT DECLARATION APPENDIX: FITTINGS LIFE CYCLE ASSESSMENT RESULTS Per the Product Category Rule, fittings must also be included in the EPD. As these piping systems are belled, fittings are not required to join the pipes together; however, 258 fittings were assumed as instructed by the PCR standard for the pressure pipe systems and 234 fittings were assumed for sanitary sewer. The life cycle impact assessment results are reported in separately in this Appendix as systems are variable in the number and type of fittings required. PRESSURE PIPE: 8” AWWA C900 FITTINGS Pressure pipe is designed with belled joints at the end of each pipe with a gasket provided so that individual pipe units can be installed easily. However, the Product Category Rule states that 258 fittings must be included in each system. Since fittings vary a weight of 12 pounds per piece were included. Please note that the number of fittings per system vary and that each pipe can be joined together without an additional fitting. Similar distances traveled for modules A2, A4 and C2 were assumed. No installation scrap was assumed since fittings are designed by piece. Module B’s energy use are assumed to be included in each individual pipe system described above and therefore not included in the fittings tables. TABLE 36: 8” AWWA C900 FITTINGS LIFE CYCLE IMPACT ASSESSMENT Disposal Stage Product Stage Use Stage Unit (per 258 fittings) Construction Stage TRACI v2.1 A1-A3 A4 A5 B1-B7 C1-C4 GWP Global Warming Potential kg CO2 eq 3.21E+03 6.00E+01 0.00E+00 0.00E+00 1.39E+01 Depletion Potential of the Stratospheric Ozone Layer kg CFC-11 eq 4.88E-04 2.29E-09 0.00E+00 0.00E+00 3.20E-06 ODP AP Acidification Potential kg SO2 eq 2.52E+01 3.58E-01 0.00E+00 0.00E+00 1.51E-01 EP Eutrophication Potential kg N eq 2.48E+00 2.00E-02 0.00E+00 0.00E+00 1.76E-02 POCP Photochemical Ozone Creation Potential kg O3 eq 1.56E+02 9.81E+00 0.00E+00 0.00E+00 3.82E+00 Product Stage Disposal Stage Construction Stage Use Stage Unit (per 258 fittings) CML 2 Baseline 2001 A1-A3 A4 A5 B1-B7 C1-C4 GWP Global Warming Potential kg CO2 eq 3.26E+03 6.02E+01 0.00E+00 0.00E+00 1.40E+01 Depletion Potential of the Stratospheric Ozone Layer kg CFC-11 eq 1.72E-04 2.27E-09 0.00E+00 0.00E+00 2.40E-06 ODP AP Acidification Potential kg SO2 eq 2.74E+01 2.96E-01 0.00E+00 0.00E+00 1.21E-01 EP Eutrophication Potential kg PO4 eq 1.70E+00 5.24E-02 0.00E+00 0.00E+00 2.62E-02 POCP Photochemical Ozone Creation Potential kg C2H4 eq 1.50E+00 1.36E-02 0.00E+00 0.00E+00 -1.22E-02 Abiotic Depletion Potential for Fossil Resources ADPF MJ 8.99E+04 7.72E+02 0.00E+00 0.00E+00 3.01E+02 EPD Program Operator NSF International 789 N. Dixboro Rd. Ann Arbor, MI 48105 USA www.nsfsustainability.org 36 Date of Issue: March 21, 2023 Period of Validity: 5 years Declaration#: EPD10047
ENVIRONMENTAL PRODUCT DECLARATION TABLE 37: 8” AWWA C900 FITTINGS USE OF RESOURCES Disposal Stage Product Stage Use Stage Unit (per 258 fittings) Construction Stage Use of Resources A1-A3 A4 A5 B1-B7 C1-C4 Non-renewable Primary Resources Used as an Energy Carrier NRPRE MJ 6.90E+04 0.00E+00 0.00E+00 0.00E+00 3.03E+02 Renewable Primary Resources Used as an Energy Carrier MJ 6.91E+02 0.00E+00 0.00E+00 0.00E+00 1.66E+00 RPRE Non-renewable Primary Resources With Energy Content Used as a Material kg 2.40E+04 0.00E+00 0.00E+00 0.00E+00 0.00E+00 NRPRM Renewable Primary Resources With Energy Content Used as a Material kg 6.52E+02 0.00E+00 0.00E+00 0.00E+00 0.00E+00 RPRM SM Use of Secondary Materials kg 0.00E+00 0.00E+00 0.00E+00 0.00E+00 0.00E+00 RSF Renewable Secondary Fuels MJ 0.00E+00 0.00E+00 0.00E+00 0.00E+00 0.00E+00 NRSF Use of Non-Renewable Secondary Fuels MJ 0.00E+00 0.00E+00 0.00E+00 0.00E+00 0.00E+00 m3 FW Fresh Water Consumption 1.06E+01 0.00E+00 0.00E+00 0.00E+00 2.20E-01 NRN Non-renewable Nuclear MJ 0.00E+00 0.00E+00 0.00E+00 0.00E+00 0.00E+00 TABLE 38: 8” AWWA C900 FITTINGS OUTPUT FLOWS Disposal Stage Product Stage Use Stage Unit (per 258 fittings) Construction Stage Parameter A1-A3 A4 A5 B1-B7 C1-C4 HWD Disposed-of Hazardous Waste kg 3.36E-02 0.00E+00 0.00E+00 0.00E+00 0.00E+00 NHWD Disposed-of Non-hazardous Waste kg 1.04E+01 0.00E+00 1.06E+02 0.00E+00 1.41E+03 RWD Disposed-of Radioactive Waste kg 0.00E+00 0.00E+00 0.00E+00 0.00E+00 0.00E+00 CRU Components for Reuse kg 0.00E+00 0.00E+00 0.00E+00 0.00E+00 0.00E+00 MFR Materials for Recycling kg 7.35E+00 0.00E+00 0.00E+00 0.00E+00 0.00E+00 MET Materials for Energy Recovery kg 0.00E+00 0.00E+00 0.00E+00 0.00E+00 0.00E+00 Exported Electrical Energy (Waste to Energy) Exported Thermal Energy (Waste to Energy) Bio-Based Products MJ 0.00E+00 0.00E+00 0.00E+00 0.00E+00 0.00E+00 EEE EET MJ 0.00E+00 0.00E+00 0.00E+00 0.00E+00 0.00E+00 BBPr kg CO2 eq 0.00E+00 0.00E+00 0.00E+00 0.00E+00 0.00E+00 BBPk Bio-Based Packaging kg CO2 eq -3.46E+01 0.00E+00 3.46E+01 0.00E+00 0.00E+00 EPD Program Operator NSF International 789 N. Dixboro Rd. Ann Arbor, MI 48105 USA www.nsfsustainability.org 37 Date of Issue: March 21, 2023 Period of Validity: 5 years Declaration#: EPD10047
ENVIRONMENTAL PRODUCT DECLARATION PRESSURE PIPE: 24” AWWA C900 FITTINGS Pressure pipe is designed with belled joints at the end of each pipe with a gasket provided so that individual pipe units can be installed easily. However, the Product Category Rule states that 258 fittings must be included in each system. Since fittings vary a weight of 130 pounds per piece were included. Please note that the number of fittings per system vary and that each pipe can be joined together without an additional fitting. Similar distances traveled for modules A2, A4 and C2 were assumed. No installation scrap was assumed since fittings are designed by piece. Module B’s energy use are assumed to be included in each individual pipe system described above and therefore not included in the fittings tables. TABLE 39: 24” AWWA C900 FITTINGS LIFE CYCLE IMPACT ASSESSMENT Disposal Stage Product Stage Use Stage Unit (per 258 fittings) Construction Stage TRACI v2.1 A1-A3 A4 A5 B1-B7 C1-C4 GWP Global Warming Potential kg CO2 eq 3.48E+04 6.50E+02 0.00E+00 0.00E+00 1.39E+01 Depletion Potential of the Stratospheric Ozone Layer kg CFC-11 eq 5.29E-03 2.48E-08 0.00E+00 0.00E+00 3.20E-06 ODP AP Acidification Potential kg SO2 eq 2.73E+02 3.88E+00 0.00E+00 0.00E+00 1.51E-01 EP Eutrophication Potential kg N eq 2.69E+01 2.16E-01 0.00E+00 0.00E+00 1.76E-02 POCP Photochemical Ozone Creation Potential kg O3 eq 1.69E+03 1.06E+02 0.00E+00 0.00E+00 3.82E+00 Product Stage Disposal Stage Construction Stage Use Stage Unit (per 258 fittings) CML 2 Baseline 2001 A1-A3 A4 A5 B1-B7 C1-C4 GWP Global Warming Potential kg CO2 eq 3.53E+04 6.52E+02 0.00E+00 0.00E+00 1.40E+01 Depletion Potential of the Stratospheric Ozone Layer kg CFC-11 eq 1.87E-03 2.46E-08 0.00E+00 0.00E+00 2.40E-06 ODP AP Acidification Potential kg SO2 eq 2.97E+02 3.20E+00 0.00E+00 0.00E+00 1.21E-01 EP Eutrophication Potential kg PO4 eq 1.84E+01 5.68E-01 0.00E+00 0.00E+00 2.62E-02 POCP Photochemical Ozone Creation Potential kg C2H4 eq 1.62E+01 1.48E-01 0.00E+00 0.00E+00 -1.22E-02 Abiotic Depletion Potential for Fossil Resources ADPF MJ 9.74E+05 8.36E+03 0.00E+00 0.00E+00 3.01E+02 EPD Program Operator NSF International 789 N. Dixboro Rd. Ann Arbor, MI 48105 USA www.nsfsustainability.org 38 Date of Issue: March 21, 2023 Period of Validity: 5 years Declaration#: EPD10047
ENVIRONMENTAL PRODUCT DECLARATION TABLE 40: 24” AWWA C900 FITTINGS USE OF RESOURCES Disposal Stage Product Stage Use Stage Unit (per 258 fittings) Construction Stage Use of Resources A1-A3 A4 A5 B1-B7 C1-C4 Non-renewable Primary Resources Used as an Energy Carrier NRPRE MJ 9.84E+05 0.00E+00 0.00E+00 0.00E+00 3.03E+02 Renewable Primary Resources Used as an Energy Carrier MJ 1.39E+04 0.00E+00 0.00E+00 0.00E+00 1.66E+00 RPRE Non-renewable Primary Resources With Energy Content Used as a Material kg 2.40E+04 0.00E+00 0.00E+00 0.00E+00 0.00E+00 NRPRM Renewable Primary Resources With Energy Content Used as a Material kg 6.52E+02 0.00E+00 0.00E+00 0.00E+00 0.00E+00 RPRM SM Use of Secondary Materials kg 0.00E+00 0.00E+00 0.00E+00 0.00E+00 0.00E+00 RSF Renewable Secondary Fuels MJ 0.00E+00 0.00E+00 0.00E+00 0.00E+00 0.00E+00 NRSF Use of Non-Renewable Secondary Fuels MJ 0.00E+00 0.00E+00 0.00E+00 0.00E+00 0.00E+00 m3 FW Fresh Water Consumption 1.15E+02 0.00E+00 0.00E+00 0.00E+00 2.20E-01 NRN Non-renewable Nuclear MJ 0.00E+00 0.00E+00 0.00E+00 0.00E+00 0.00E+00 TABLE 41: 24” AWWA C900 FITTINGS OUTPUT FLOWS Disposal Stage Product Stage Use Stage Unit (per 258 fittings) Construction Stage Parameter A1-A3 A4 A5 B1-B7 C1-C4 HWD Disposed-of Hazardous Waste kg 3.36E-02 0.00E+00 0.00E+00 0.00E+00 0.00E+00 NHWD Disposed-of Non-hazardous Waste kg 1.04E+01 0.00E+00 1.06E+02 0.00E+00 1.41E+03 RWD Disposed-of Radioactive Waste kg 0.00E+00 0.00E+00 0.00E+00 0.00E+00 0.00E+00 CRU Components for Reuse kg 0.00E+00 0.00E+00 0.00E+00 0.00E+00 0.00E+00 MFR Materials for Recycling kg 7.35E+00 0.00E+00 0.00E+00 0.00E+00 0.00E+00 MET Materials for Energy Recovery kg 0.00E+00 0.00E+00 0.00E+00 0.00E+00 0.00E+00 Exported Electrical Energy (Waste to Energy) Exported Thermal Energy (Waste to Energy) Bio-Based Products MJ 0.00E+00 0.00E+00 0.00E+00 0.00E+00 0.00E+00 EEE EET MJ 0.00E+00 0.00E+00 0.00E+00 0.00E+00 0.00E+00 BBPr kg CO2 eq 0.00E+00 0.00E+00 0.00E+00 0.00E+00 0.00E+00 BBPk Bio-Based Packaging kg CO2 eq -3.46E+01 0.00E+00 3.46E+01 0.00E+00 0.00E+00 EPD Program Operator NSF International 789 N. Dixboro Rd. Ann Arbor, MI 48105 USA www.nsfsustainability.org 39 Date of Issue: March 21, 2023 Period of Validity: 5 years Declaration#: EPD10047
ENVIRONMENTAL PRODUCT DECLARATION SANITARY SEWER PIPE: 8” SOLID-WALL ASTM D3034 FITTINGS Nonpressure pipe is designed with belled joints at the end of each pipe with a gasket provided so that individual pipe units can be installed easily. However, the Product Category Rule states that 234 fittings must be included in each system. Since fittings vary a weight of 4.5 pounds per piece were included. Please note that the number of fittings per system vary and that each pipe can be joined together without an additional fitting. Similar distances traveled for modules A2, A4 and C2 were assumed. No installation scrap was assumed since fittings are designed by piece. Module B’s energy use are assumed to be included in each individual pipe system described above and therefore not included in the fittings tables. TABLE 42: 8” SOLID-WALL ASTM D3034 FITTINGS LIFE CYCLE IMPACT ASSESSMENT Disposal Stage Product Stage Use Stage Unit (per 234 fittings) Construction Stage TRACI v2.1 A1-A3 A4 A5 B1-B7 C1-C4 GWP Global Warming Potential kg CO2 eq 1.07E+03 2.11E+01 0.00E+00 0.00E+00 4.74E+00 Depletion Potential of the Stratospheric Ozone Layer kg CFC-11 eq 1.47E-04 8.03E-10 0.00E+00 0.00E+00 1.09E-06 ODP AP Acidification Potential kg SO2 eq 7.94E+00 1.26E-01 0.00E+00 0.00E+00 5.13E-02 EP Eutrophication Potential kg N eq 1.14E+00 7.01E-03 0.00E+00 0.00E+00 5.98E-03 POCP Photochemical Ozone Creation Potential kg O3 eq 5.72E+01 3.44E+00 0.00E+00 0.00E+00 1.30E+00 Product Stage Disposal Stage Construction Stage Use Stage Unit (per 234 fittings) CML 2 Baseline 2001 A1-A3 A4 A5 B1-B7 C1-C4 GWP Global Warming Potential kg CO2 eq 1.08E+03 2.11E+01 0.00E+00 0.00E+00 4.76E+00 Depletion Potential of the Stratospheric Ozone Layer kg CFC-11 eq 5.28E-05 7.96E-10 0.00E+00 0.00E+00 8.18E-07 ODP AP Acidification Potential kg SO2 eq 8.54E+00 1.04E-01 0.00E+00 0.00E+00 4.10E-02 EP Eutrophication Potential kg PO4 eq 7.41E-01 1.84E-02 0.00E+00 0.00E+00 8.92E-03 POCP Photochemical Ozone Creation Potential kg C2H4 eq 4.90E-01 4.78E-03 0.00E+00 0.00E+00 -4.14E-03 Abiotic Depletion Potential for Fossil Resources ADPF MJ 2.73E+04 2.71E+02 0.00E+00 0.00E+00 1.02E+02 EPD Program Operator NSF International 789 N. Dixboro Rd. Ann Arbor, MI 48105 USA www.nsfsustainability.org 40 Date of Issue: March 21, 2023 Period of Validity: 5 years Declaration#: EPD10047
ENVIRONMENTAL PRODUCT DECLARATION TABLE 43: 8” SOLID-WALL ASTM D3034 FITTINGS USE OF RESOURCES Disposal Stage Product Stage Use Stage Unit (per 234 fittings) Construction Stage Use of Resources A1-A3 A4 A5 B1-B7 C1-C4 Non-renewable Primary Resources Used as an Energy Carrier NRPRE MJ 2.03E+04 0.00E+00 0.00E+00 0.00E+00 1.03E+02 Renewable Primary Resources Used as an Energy Carrier MJ 7.81E+02 0.00E+00 0.00E+00 0.00E+00 5.66E-01 RPRE Non-renewable Primary Resources With Energy Content Used as a Material kg 8.17E+03 0.00E+00 0.00E+00 0.00E+00 0.00E+00 NRPRM Renewable Primary Resources With Energy Content Used as a Material kg 2.22E+02 0.00E+00 0.00E+00 0.00E+00 0.00E+00 RPRM SM Use of Secondary Materials kg 0.00E+00 0.00E+00 0.00E+00 0.00E+00 0.00E+00 RSF Renewable Secondary Fuels MJ 0.00E+00 0.00E+00 0.00E+00 0.00E+00 0.00E+00 NRSF Use of Non-Renewable Secondary Fuels MJ 0.00E+00 0.00E+00 0.00E+00 0.00E+00 0.00E+00 m3 FW Fresh Water Consumption 4.33E+00 0.00E+00 0.00E+00 0.00E+00 7.47E-02 NRN Non-renewable Nuclear MJ 0.00E+00 0.00E+00 0.00E+00 0.00E+00 0.00E+00 TABLE 44: 8” SOLID-WALL ASTM D3034 FITTINGS OUTPUT FLOWS Disposal Stage Product Stage Use Stage Unit (per 234 fittings) Construction Stage Parameter A1-A3 A4 A5 B1-B7 C1-C4 HWD Disposed-of Hazardous Waste kg 1.14E-02 0.00E+00 0.00E+00 0.00E+00 0.00E+00 NHWD Disposed-of Non-hazardous Waste kg 3.55E+00 0.00E+00 3.61E+01 0.00E+00 4.78E+02 RWD Disposed-of Radioactive Waste kg 0.00E+00 0.00E+00 0.00E+00 0.00E+00 0.00E+00 CRU Components for Reuse kg 0.00E+00 0.00E+00 0.00E+00 0.00E+00 0.00E+00 MFR Materials for Recycling kg 2.50E+00 0.00E+00 0.00E+00 0.00E+00 0.00E+00 MET Materials for Energy Recovery kg 0.00E+00 0.00E+00 0.00E+00 0.00E+00 0.00E+00 Exported Electrical Energy (Waste to Energy) Exported Thermal Energy (Waste to Energy) Bio-Based Products MJ 0.00E+00 0.00E+00 0.00E+00 0.00E+00 0.00E+00 EEE MJ 0.00E+00 0.00E+00 0.00E+00 0.00E+00 0.00E+00 EET BBPr kg CO2 eq 0.00E+00 0.00E+00 0.00E+00 0.00E+00 0.00E+00 BBPk Bio-Based Packaging kg CO2 eq -1.18E+01 0.00E+00 1.18E+01 0.00E+00 0.00E+00 EPD Program Operator NSF International 789 N. Dixboro Rd. Ann Arbor, MI 48105 USA www.nsfsustainability.org 41 Date of Issue: March 21, 2023 Period of Validity: 5 years Declaration#: EPD10047
ENVIRONMENTAL PRODUCT DECLARATION SANITARY SEWER PIPE: 24” SOLID-WALL ASTM F679 FITTINGS Nonpressure pipe is designed with belled joints at the end of each pipe with a gasket provided so that individual pipe units can be installed easily. However, the Product Category Rule states that 234 fittings must be included in each system. Since fittings vary a weight of 60 pounds per piece were included. Please note that the number of fittings per system vary and that each pipe can be joined together without an additional fitting. Similar distances traveled for modules A2, A4 and C2 were assumed. No installation scrap was assumed since fittings are designed by piece. Module B’s energy use are assumed to be included in each individual pipe system described above and therefore not included in the fittings tables. TABLE 45: 24” SOLID-WALL ASTM F679 FITTINGS LIFE CYCLE IMPACT ASSESSMENT Disposal Stage Product Stage Use Stage Unit (per 234 fittings) Construction Stage TRACI v2.1 A1-A3 A4 A5 B1-B7 C1-C4 GWP Global Warming Potential kg CO2 eq 1.45E+04 2.85E+02 0.00E+00 0.00E+00 6.42E+01 Depletion Potential of the Stratospheric Ozone Layer kg CFC-11 eq 2.00E-03 1.09E-08 0.00E+00 0.00E+00 1.48E-05 ODP AP Acidification Potential kg SO2 eq 1.08E+02 1.70E+00 0.00E+00 0.00E+00 6.95E-01 EP Eutrophication Potential kg N eq 1.55E+01 9.50E-02 0.00E+00 0.00E+00 8.11E-02 POCP Photochemical Ozone Creation Potential kg O3 eq 7.75E+02 4.67E+01 0.00E+00 0.00E+00 1.76E+01 Product Stage Disposal Stage Construction Stage Use Stage Unit (per 234 fittings) CML 2 Baseline 2001 A1-A3 A4 A5 B1-B7 C1-C4 GWP Global Warming Potential kg CO2 eq 1.47E+04 2.86E+02 0.00E+00 0.00E+00 6.45E+01 Depletion Potential of the Stratospheric Ozone Layer kg CFC-11 eq 7.16E-04 1.08E-08 0.00E+00 0.00E+00 1.11E-05 ODP AP Acidification Potential kg SO2 eq 1.16E+02 1.41E+00 0.00E+00 0.00E+00 5.56E-01 EP Eutrophication Potential kg PO4 eq 1.00E+01 2.49E-01 0.00E+00 0.00E+00 1.21E-01 POCP Photochemical Ozone Creation Potential kg C2H4 eq 6.64E+00 6.48E-02 0.00E+00 0.00E+00 -5.61E-02 Abiotic Depletion Potential for Fossil Resources ADPF MJ 3.70E+05 3.67E+03 0.00E+00 0.00E+00 1.39E+03 EPD Program Operator NSF International 789 N. Dixboro Rd. Ann Arbor, MI 48105 USA www.nsfsustainability.org 42 Date of Issue: March 21, 2023 Period of Validity: 5 years Declaration#: EPD10047
ENVIRONMENTAL PRODUCT DECLARATION TABLE 46: 24” SOLID-WALL ASTM F679 FITTINGS USE OF RESOURCES Disposal Stage Product Stage Use Stage Unit (per 234 fittings) Construction Stage Use of Resources A1-A3 A4 A5 B1-B7 C1-C4 Non-renewable Primary Resources Used as an Energy Carrier NRPRE MJ 2.75E+05 0.00E+00 0.00E+00 0.00E+00 1.40E+03 Renewable Primary Resources Used as an Energy Carrier MJ 1.06E+04 0.00E+00 0.00E+00 0.00E+00 7.68E+00 RPRE Non-renewable Primary Resources With Energy Content Used as a Material kg 1.11E+05 0.00E+00 0.00E+00 0.00E+00 0.00E+00 NRPRM Renewable Primary Resources With Energy Content Used as a Material kg 3.00E+03 0.00E+00 0.00E+00 0.00E+00 0.00E+00 RPRM SM Use of Secondary Materials kg 0.00E+00 0.00E+00 0.00E+00 0.00E+00 0.00E+00 RSF Renewable Secondary Fuels MJ 0.00E+00 0.00E+00 0.00E+00 0.00E+00 0.00E+00 NRSF Use of Non-Renewable Secondary Fuels MJ 0.00E+00 0.00E+00 0.00E+00 0.00E+00 0.00E+00 m3 FW Fresh Water Consumption 5.87E+01 0.00E+00 0.00E+00 0.00E+00 1.01E+00 NRN Non-renewable Nuclear MJ 0.00E+00 0.00E+00 0.00E+00 0.00E+00 0.00E+00 TABLE 47: 24” SOLID-WALL ASTM F679 FITTINGS OUTPUT FLOWS Disposal Stage Product Stage Use Stage Unit (per 234 fittings) Construction Stage Parameter A1-A3 A4 A5 B1-B7 C1-C4 HWD Disposed-of Hazardous Waste kg 1.55E-01 0.00E+00 0.00E+00 0.00E+00 0.00E+00 NHWD Disposed-of Non-hazardous Waste kg 4.81E+01 0.00E+00 4.90E+02 0.00E+00 6.48E+03 RWD Disposed-of Radioactive Waste kg 0.00E+00 0.00E+00 0.00E+00 0.00E+00 0.00E+00 CRU Components for Reuse kg 0.00E+00 0.00E+00 0.00E+00 0.00E+00 0.00E+00 MFR Materials for Recycling kg 3.39E+01 0.00E+00 0.00E+00 0.00E+00 0.00E+00 MET Materials for Energy Recovery kg 0.00E+00 0.00E+00 0.00E+00 0.00E+00 0.00E+00 Exported Electrical Energy (Waste to Energy) Exported Thermal Energy (Waste to Energy) Bio-Based Products MJ 0.00E+00 0.00E+00 0.00E+00 0.00E+00 0.00E+00 EEE MJ 0.00E+00 0.00E+00 0.00E+00 0.00E+00 0.00E+00 EET BBPr kg CO2 eq 0.00E+00 0.00E+00 0.00E+00 0.00E+00 0.00E+00 BBPk Bio-Based Packaging kg CO2 eq -1.60E+02 0.00E+00 1.60E+02 0.00E+00 0.00E+00 EPD Program Operator NSF International 789 N. Dixboro Rd. Ann Arbor, MI 48105 USA www.nsfsustainability.org 43 Date of Issue: March 21, 2023 Period of Validity: 5 years Declaration#: EPD10047
Environmental Product Declaration Uni-Bell PVC Pipe Association – PVC Pipe Products