Download
1 / 31
320 likes | 817 Vues
The Central Dogma of Molecular Biology: How Genes Lead to Proteins. Crick and others mused over the ``two great polymer languages’’. Central dogma explains the chain of events relating them. The ribosome is the universal translating machine that speaks both languages.

E N D
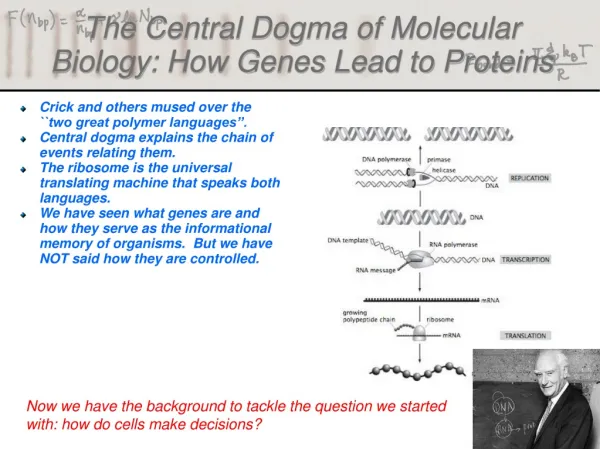
The Central Dogma of Molecular Biology: How Genes Lead to Proteins Crick and others mused over the ``two great polymer languages’’. Central dogma explains the chain of events relating them. The ribosome is the universal translating machine that speaks both languages. We have seen what genes are and how they serve as the informational memory of organisms. But we have NOT said how they are controlled. (Berman et al.) Now we have the background to tackle the question we started with: how do cells make decisions?
Not All DNA Codes for Proteins The E. coli genome is a circle with roughly 4.7 million base pairs. How many genes? An estimate. The genes related to sugar usage have been one of the most important stories in the history of modern biology and biochemistry (and take us right back to the great debate on vitalism played out with Pasteur in the 1800s). “Promoter” region on DNA is subject to intervention by various molecular bouncers that govern the gene. (Berman et al.) The regulatory landscape
Ways to Measure Gene Expression Basic point: looking for “reporters” of the level of expression of gene of interest. Can ask the system to report on the level of gene expression at various steps in the processes linking DNA to active protein. Promoter occupancy, level of mRNA, level of active protein. http://www.lbl.gov/Science-Articles/Archive/sabl/2008/Feb/genome-mystery.html This image shows a Drosophila embryo colored to show the expression patterns of early gene regulators. Each color represents the level of expression of one of three gene regulators, Knirps (green), Kruppel (blue), and Giant (red). Color intensity reflects a higher level of expression. The darker areas of the embryo are cells where none of these gene regulators are expressed, and the yellowish areas indicate that both Knirps and Giant are being expressed.
Enzymatic Assay or In-Situ Hybridization Enzymatic assays – promoter leads to the production of a protein that then does some enzymatic action on the substrate which yields a product that can be visualized. In-situ hybridization – described the other day – probe is complementary to the RNA of interest and is labelled for detection.
Enzymatic Assay or In-Situ Hybridization Enzymatic assays – promoter leads to the production of a protein that then does some enzymatic action on the substrate which yields a product that can be visualized. In-situ hybridization -
Department of Physics Information Processing in Living Cells:Beyond First Approximations Ido Golding Caltech 11/2008
Simple Case of Turning a Gene “On” s(t) Stimulus (sugar) t r(t) Response (RNA production) t Approximations used to describe the process…
(RNA-tagging protein; in excess in the cell) MS2-GFP Gene of interest: binding Plac/ara RFP 96x MS2-bs transcription RNA target IPTG, arabinose translation RFP protein Engineering bacteria to report on gene activity Golding et al., Cell (2005)
Measuring mRNA & protein numbers mRNA number of bound MS2-GFPs photon flux from localized green fluorescence Protein number of RFPs photon flux from whole-cell red fluorescence Histogram of RNA copy number: 1st peak = inter-peak interval 50-100 X GFP = 1 transcript Controls: FISH Controls: QPCR Protein levels (Thanks to: A. Raj, A. van Oudenaarden) Lux: Lutz & Bujard 1997
RNA kinetics in individual cells Distribution of on & off times # mRNA vs time Distribution of burst size
Transcriptional bursting in eukaryotes Chubb JR, Trcek T, Shenoy SM, Singer RH. Curr. Biol. (2006) See also: Golding & Cox, Curr. Biol. (2006) Raj A, Peskin CS, Tranchina D, Vargas DY, Tyagi S, PLoS Biol. (2006) “Stochastic mRNA Synthesis in Mammalian Cells”.
The Lambda Switch: The Other Hydrogen Atom of Gene Regulation Roger Hendrix
Bacteriophage and Their Genomes http://www.biochem.wisc.edu/inman/empics/0020b.jpg
Physical Consequences of the Tight Squeeze in the Life Cycle of a Bacteriophage Rate of ejection: ≈ 100 - 1000bp/sec Forceful ejection Construct a physical model of these processes. Rate of packing: 100bp/sec “Some assembly required” Self-assembly
Synthetic Genetic Switch Collins et al. - see course website
Synthetic Genetic Switch Collins et al. - see course website
Gene Expression in Cyanobacteria (Mihalcescu, Hsing, Leibler, Nature 2004) a, Snapshots of phase-contrast image showing cell F and its progeny and b, related bioluminescence image at different times t (given in days, a 24 h period of time) from the beginning of the measurement. Pixels in the bioluminescence images were binned 3 times 3 (pseudo-colour, where red is high signal intensity and blue is low signal intensity). Scale bar, 5 microm. c, The size of the cell F and all its progeny as a function of time measured from the phase-contrast images (non-binned pixels). The arrows point to the time where the snapshots in (a) and (b) were taken. d, The total number of pixels occupied by F and its all progeny versus time (black line) plotted in a logarithmic scale. The red line is the corresponding exponential growth fit: total size (t) = initial size times 2t/tau with tau = 23.04 plusminus 0.17 h. e, Density of bioluminescence for the same cell and all its progeny versus time. f, The average density of bioluminescence versus time (black line) and its fit (red line) with: left fenced(t)right fence = B + A cos(2pit/T0 + phi0). The resulting period is T0 = 25.4 plusminus 0.12 h, the initial phase phi0 = 52 plusminus 2.8°, the amplitude A = 12.9 plusminus 0.3 counts per pixel and the offset B = 14.8 plusminus 0.3 counts per pixel.
Gene Expression in Cyanobacteria (Mihalcescu, Hsing, Leibler, Nature 2004) a, Upper part shows the phase-contrast snapshots of colonies A and B; lower part shows the related bioluminescence images. Scale bar, 5 microm. b, Normalized density of bioluminescence of individual cyanobacterial cells. Each colour corresponds to the progeny from one of the initial cells: red line, colony A; black line, colony B. c, Phase of individual oscillators as a function of their original colony and their evolution in time: red square, colony A; asterisk, colony B. An example of the exact location for three of the cells tracked and their phase evolution is shown, marked by the corresponding coloured lines: magenta, orange and purple. The change of the phase in time was quantified by a fit over a different period of time: the first 2 days (days 5–7), the entire time (days 5–10.5) and the last 2 days of the measurement (days 8.5–10.5). The fit function is left fenced(t)right fence = B + A cos(2pit/T0 + phi), with T0 = 24.78 h. The line segments in each graph, with corresponding colours, represent the resulting vector Pres = sumPi, where Pi is the unit vector whose orientation is the measured angle of the same colony cell i.
Synthetic Transcriptional Oscillator (Elowitz, Leibler, Nature 2002)


