Download
1 / 1
10 likes | 353 Vues
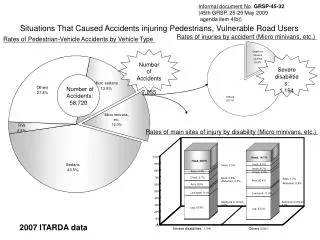
Informal document No . GRSP-45- 32 (45th GRSP, 25-29 May 2009 agenda item 4(b)) . Situations That Caused Accidents injuring Pedestrians, Vulnerable Road Users. Rates of injuries by accident (Micro minivans, etc.). Rates of Pedestrian-Vehicle Accidents by Vehicle Type . Number of

E N D
Informal document No. GRSP-45-32 (45th GRSP, 25-29 May 2009 agenda item 4(b)) Situations That Caused Accidents injuring Pedestrians, Vulnerable Road Users Rates of injuries by accident (Micro minivans, etc.) Rates of Pedestrian-Vehicle Accidents by Vehicle Type Number of Accidents: 7,055 Severe disabilities: 1,194 Number of Accidents: 58,720 Rates of main sites of injury by disability (Micro minivans, etc.) 100% Head, 16.1% Head, 28.0% 90% Face, 6.0% Neck, 2.0% Neck, 6.7% 80% Face, 3.4% Chest, 3.9% Chest, 9.7% 70% Back, 0.8% Back, 1.3% Arm, 20.4% Abdomen, 2.3% Abdomen, 0.8% Arm, 9.9% 60% 50% Low back, 9.1% Low back, 11.6% 40% Asphyxia or drown, 0.0% Asphyxia or drown, 0.0% 30% Leg, 33.8% Leg, 33.2% 20% 10% 2007 ITARDA data 0% Severe disabilities Others (1,194) (5,861)