Isolines
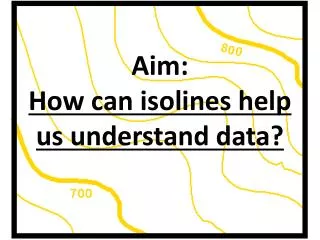
Isolines. An isoline is a line connecting points of equal value. Examples of isolines:. Isotherms: points of equal temperature Isobar: points of equal barometric (air) pressure Contour: points of equal altitude Concentration of chemicals Anything else you can get a value for.

Isolines
E N D
Presentation Transcript
Isolines • An isoline is a line connecting points of equal value.
Examples of isolines: • Isotherms: • points of equal temperature • Isobar: • points of equal barometric (air) pressure • Contour: • points of equal altitude • Concentration of chemicals • Anything else you can get a value for. • (The weather channel loves isolines!)
Rules for Drawing Isolines: • 1. Isolines connect points of equal value. 5 5 10 10 10 10 15 15
2. Isolines are gentle, curving lines- no sharp corners. 5 5 10 10 10 10 15 15
3. Isolines are always closed curves even though the map might only show part of it.
4. Isolines NEVER cross- this would mean that one point has two different values. Ex: one spot has two temperatures? 60 ° 50 ° 40 ° 30 ° X 20° Z Y
5. Isolines usually are parallel. (They have a parallel trend.)
Visualizations of contour lines • http://geology.asu.edu/~sreynolds/topo_gallery/topo_gallery.htm
Gradient • Gradient shows how quickly the value changes from one point to another.
A steep (high) gradient changes quickly and the isolines are close together. • A gentle (low) gradient changes slowly and the lines are far apart. Steep area Gentle area
Making Contours worksheets • Worksheets can be printed from: • http://www.rcmurphy.net/Medina%202005/documents/Contours123.doc