Mastering Isolines and Contour Maps in Cartography
Learn to draw isolines, decode contour maps, and understand gradients with ease. Discover patterns and interpret topographic profiles like a pro!

Mastering Isolines and Contour Maps in Cartography
E N D
Presentation Transcript
Isolines • An isoline is a line connecting points of equal value.
Examples of isolines: • Isotherms: • points of equal temperature • Isobars: • points of equal barometric (air) pressure • Contours: • points of equal altitude (elevation above sea level)
Isobars: Make concentric circles (rings) and show how air pressure changes from Low to High pressure
Isotherms: Show how temperature changes. Generallyparallel but bend
Contour Lines: show a change in elevation. They make parallel lines, AND concentric circles where the elevation increases
Rules for Drawing Isolines: • 1. Isolines connect points of equal value. 5 5 10 10 10 10 15 15
2. Isolines are gentle, curving lines- not sharp corners!. 5 5 10 10 10 10 15 15
3. Isolines are always closed curves even though the map might only show part of the overall picture.
4. Isolines NEVERcross- this would mean that one point has two different values. Look Below • Ex: How can one spot have two different temperatures? 60 ° 50 ° 40 ° 30 ° X 20° Z Y
5. Isolines usually are parallel. • (They have a parallel trend/follow a continuous pattern)
We will be working with mostly contour lines throughout the mapping portion of the unit
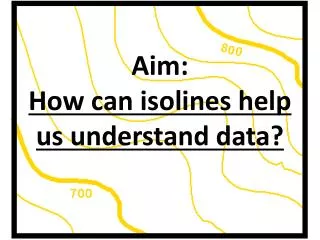
This is a contour map! It has LOTS of elevation contour lines
Notes: Working with Isolines and Contour Maps 1.) Finding Gradient and Using a Map Scale 2.) Patterns/shapes that indicate types of landscape features 3.) Using contour lines to indicate stream/water flow direction 4.) Estimating elevation between contour lines 5.) Depressions and hachured contour lines 6.) Making a profile
Calculating Gradient on a map: • Gradient shows how quickly the value changes from one point to another. The change in value is either Temp, Pressure, or usually Elevation. The distance is found using a map scale and a scrap piece of paper.
Map Scales • On every map, the measured value on the map must equal a real life distance to scale
Part II: Reading Contour Maps • Contour maps show how elevation changes. There are a few patterns to help understand what is going on: 1.) Concentric circles= indicate a hill, mountain, peak where the elevation increases. 2.) When lines make a “V” or “U” shape, that indicates there is a valley- with or without running water.
U- shaped valley V- Shaped Valley
A steep (high) gradient changes quickly and the isolines are close together. A gentle (low) gradient changes slowly and the lines are far apart. Gradient in relationship to the spacing of contours: Gentle area Steep area
How do contour lines show stream flow? Contour lines bend and make a “v” that points upslope in the OPPOSITE direction water flows
Some Basics about Contour Lines: • Contour Interval= The difference in elevation between consecutive but different value contour lines • Sometimes it’s not listed…you have to count! • What is the interval below? What are the values for both c, b, and a?
Estimating Elevation not marked: Any point marked on a map that does not lie directly on a contour line can be estimated to be the average elevation between two contour lines C= 190’ B= 170’ A=110’
Max and Min Elevations • The MAX elevation something can be without being directly on a contour line is the MAX value within that interval What is the max and min value for the star?
Contour Depression lines/ “Sinkholes” • The first depression contour will have the same value as the previous contour line; after that it ↓ by the same contour interval backwards
Benchmarks • “ BM or X” = marks EXACT elevation. X=where the metal marker on the ground is.
TOPOGRAPHIC PROFILES • TOPOGRAPHIC MAPS SHOW THE ELEVATION OR VERTICAL DISTANCE ABOVE SEA LEVEL OF THE SURFACE OF THE EARTH • TOPOGRAPHIC PROFILE IS A SIDE VIEW OF AN AREA.
WHAT DOES THIS PROFILE SHOW? VOLCANO NOTICE HACHURE DEPRESSION LINES IN CENTER SHOWING VOLCANIC VENT
For Profile A-B: Take out a piece of scrap paper and mark where A-B extends
Place a tick mark where every contour line intersects your piece of paper along A-B!
Plot each elevation along the vertical profile exactly where it was marked on your scrap! straight edge may help
Continue to plot all points, then connect all points with a smooth curve!
This is what you might expect the “profile” or cross section view of line AB to look like! Notice how the line dips below 250m where it crosses Long Creek