Download
1 / 57
570 likes | 889 Vues
Outline of this Presentation. Overview of Three CDC Investigations a) Hoopa Valley Indian Reservation, CA, November 1999 b) Los Alamos National Laboratory, NM, May 2000 c) Bitterroot Valley, MT, November 2000 2) Conclusions and Future Directions.

E N D
Outline of this Presentation • Overview of Three CDC Investigationsa) Hoopa Valley Indian Reservation, CA, November 1999 • b) Los Alamos National Laboratory, NM, May 2000 • c) Bitterroot Valley, MT, November 2000 • 2)Conclusions and Future Directions
Assessment of Health Effects and Evaluation of Interventions Associated with Forest Fires, Hoopa, California, August-October 1999 Joshua Mott, PhD; Pamela Meyer, PhD; Eva Smith, MD; David Mannino, MD; Emmett Chase MD; Stephen Redd, MD EPI-AID 2000-09
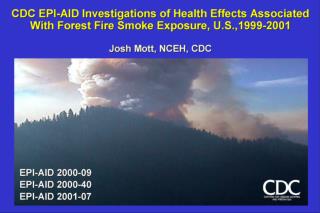
Smoke from Wildand Fires in the area of theHoopa Valley Indian Reservation 9/30/1999 * Hoopa
Hoopa Valley Indian Reservation • Trinity River Valley, northern California • 770 tribal households • 57% poverty • 32% unemployment
Ambient Particulate Matter < 10 Microns (PM10), Hoopa Valley Indian Reservation, September 28-October 28, 1999 700 PM10, 24-hour Average 600 500 Hazardous > 425 µg/m3 (24 hours) µg/m3 400 300 Standard > 150 µg/m3 (24 hours) 200 100 0 Sept. 28 Oct. 1 Oct. 8 Oct. 15 Oct. 22 Oct. 28 Time period
Average Weekly PM10 Levels and Number of Respiratory Visits to K’ima:w Medical Center, By Week, August-November, 1998,1999 Pm10 (g/m3) PM10 (g/m3) Weekly # of respiratory visits Weekly # of respiratory visits Aug. Sep. Oct. Nov. Aug. Sep. Oct. Nov. 1998 1999
Number of Asthma Visits by Week of Visit and Average Weekly PM10 Levels, Hoopa, CA, 1998, 1999* 1998 1999 * Average Number of People at Hotels funded by NCIDC in 1999 Wk 9: 66; Wk 10: 444; Wk 11: 313
Number of COPD Visits by Week of Visit and Average Weekly PM10 Levels, Hoopa, CA, 1998, 1999* 1998 1999 * Average Number of People at Hotels funded by NCIDC in 1999 Wk 9: 66; Wk 10: 444; Wk 11: 313
Number of Visits for Headaches by Week of Visit and Average Weekly PM10 Levels, Hoopa, CA, 1998, 1999* 1998 1999 * Average Number of People at Hotels funded by NCIDC in 1999 Wk 9: 66; Wk 10: 444; Wk 11: 313
Number of Coronary Artery Disease Visits by Week of Visit and Average Weekly PM10 Levels, Hoopa, CA, 1998, 1999* 1998 1999 * Average Number of People at Hotels funded by NCIDC in 1999 Wk 9: 66; Wk 10: 444; Wk 11: 313
Selected Drugs Dispensed by KMC Pharmacy by Year, Hoopa, CA, 1998-1999 350 319 300 250 Albuterol 178 Units Dispensed 200 Atrovent Azmacort 150 106 Vancenase 100 56 50 24 50 22 15 0 1998 1999 Year
Interventions Implemented by Tribal Council and Staff of K’ima:w Medical Center September-October 1999 • Filtered and non-filtered masks • Free hotel vouchers • HEPA Cleaners • Public service announcements (PSAs) • Preferential Distribution of Interventions CDC arrived to assist in assessment of health effects and evaluation of interventions – 11/08/99
Objectives of the CDC Investigation • To assess the health impact of the smoke • By pre-existing cardiopulmonary condition • To evaluate the impact of interventions
Methods • Cross-sectional survey • No pre-existing conditions, N=197 • Pre-existing conditions, N=92 • Pre-existing conditions defined as… “one or more visits in the last year for CAD, asthma, COPD, or other lung disease” • N=289, 78.5% response rate
Survey questions • Measures of Exposure • Symptom frequency (on a scale of 1-5) • BEFORE the heavy smoke began (baseline) • DURING the heavy smoke (Aug. 23-Oct. 26) • AFTER the heavy smoke ended (Oct. 27-Nov.15)
Outcome Definition • Lower respiratory symptoms • Breathing difficulty • Chest pain • Coughing • Dichotomous outcome variables • Worse from before to during the smoke • Worse from before to after the smoke (post-fire symptoms)
Pre-existing conditions No pre-existing conditions % worse during the smoke 64.1% 61.9% % still worse after the smoke 23.9% 21.3% Self-Reported Impact of the Heavy Smoke on Lower Respiratory Symptoms
Pre-existing condition No pre-existing condition Before the smoke 1.08 0.38 During the smoke 1.46 1.07 After the smoke 0.92 0.52 Mean Number of Reported Lower Respiratory Symptoms: Before, During, and After the Smoke
Sample Participation Rates For InterventionsImplemented by K’ima:w Medical Center Number Percent Participating Participating Wore a Mask 100/286 35% Evacuated Reservation 140/287 48% Ran HEPA Cleaner at Home98/287 34% Recalled and Recited a PSA223/289 77%
Intervention Evaluation:Analysis Strategy for Confounding by Severity • Outcome of interest is post-fire symptoms • Assessed increased participation among only those who received interventions • Multiple logistic regression, all results are adjusted for: • Frequency of symptoms at baseline • Income • Age • Hours per day normally spent outside
Associations Between Exposure Indices and the Odds of Reporting Worsening Lower Respiratory Symptoms, Hoopa, California, 1999 aOR 95% CI p-value Household income 1.19 0.98-1.44 .080 Female Sex 1.75 0.88-3.49 .111 Poorer home condition 1.40 0.97-2.04 .075 Home < 650 feet in altitude Hours per day outside 6.02 1.12 0.75-48.56 .092 1.03-1.22 .007 • Odds of worsening lower respiratory symptoms
Effect of Duration of Mask Use Among Those Who Received Filtered Masks, Hoopa, California, 1999 aOR 95% CI Bottom 25% (wore mask 0-2 hours/week) 26-50% (wore a mask 3-7 hours/week) 1.78 0.47-6.69 51-75% (wore a mask 8-24 hours/week) 1.59 0.39-6.45 Top 25% (wore a mask > 25 hours/week) 1.45 0.33-6.34 • Odds of worsening lower respiratory symptoms Reference Group N = 100 (those who received filtered masks)
Effect of Duration and Timing of Evacuation Among Those Who Left the Reservation, Hoopa, California, 1999 Odds of worsening lower respiratory symptoms aOR 95% CI 0.98 0.91-1.06 Total Days Away from Reservation 0.39-3.64 1.20 Evacuated for top 3 days of PM10 N = 140 (who evacuated the reservation)
Effect of Duration of HEPA Cleaner Use Among Those Who Received HEPA Cleaners, Hoopa, California, 1999 Odds of worsening lower respiratory symptoms aOR 95% CI Total time HEPA Cleaner was run 0.95 0.89-1.00 Bottom 25% (0-72 hours of use) Reference Group 26-50% (73-162 hours of use) 0.59 0.13-2.73 51-75% (163-336 hours of use) 0.39 0.11-1.45 Top 25% (> 337 hours of use) 0.18 0.04-0.87 N = 98 (those who received HEPA filters)
HEPA Cleaners vs. Evacuation? Of those who participated in each intervention…
Financial and Occupational Barriers to Evacuation. • 44% of the responses of those who didn’t go to a hotel indicated occupational barriers. • 12% indicated economic constraints. • Those with pre-existing conditions were not less • likely than those without pre-existing conditions • to work in the fire camps.
Public Service Announcements Remain indoors - 78.6% Wear face covering - 44.1% Leave area temporarily - 34.5% Close windows - 23.9% Restrict strenuous outdoor activity - 19.4% Use air conditioning - 9.7% SourceRadio - 51.5% Doctor - 37.2% Friend/family - 21.3% Employer - 17.2% Television - 13.9% Newspaper - 6.7%
Effect of Receiving Public Service Announcements (PSAs), Hoopa, California, 1999 aOR 95% CI Did not recall any PSAs Recited one PSA 0.47 0.21-1.05 Recited two PSAs 0.38 0.17-0.89 Recited three or more PSAs 0.03 0.01-0.22 • Odds of worsening lower respiratory symptoms Reference Group N = 289
Limitations • Observational Study•looked for dose-response effects within groups • • post-fire outcomes • 2. No Measure of Personal Exposure • •Urinary methoxyphenols not validated • •DNA, Hb and Albumin Adducts not yet validated • •Could not use personal exposure monitors • 3. Self-report data • • Uncertain correlation with more severe outcomes • • Recall bias • •Common reporter bias
Conclusions: Health Effects • Prioritize interventions to those with pre-existing cardiopulmonary conditions • Continue to implement programs to reduce exposure in the entire population
Conclusions: Interventions • Mask Use: Ineffective • PSA’s: Effective, but mechanism unclear • HEPA Cleaners: Effective, need validation • Evacuation: Ineffective, not feasible
Future Directions • Validate a biomarker for wood smoke exposure. • Continue to evaluate interventions using objective indicators of exposure and health effects.
Investigation of Exposures from the Cerro Grande Fire, Los Alamos, New Mexico, May 2000Epi-Aid 2000-40 • Mitchell Wolfe, Joshua Mott, Ron Voorhees, C. Mack Sewell, C.M. Wood, Dan Paschal, Stephen Redd
BackgroundCerro Grande Fire • May 4: Controlled burn by Nat’l Park Service begins in Bandelier National Monument adjacent to Los Alamos National Lab (LANL), approx 25 mi. NW of Santa Fe. • May 5: Declared wildland fire. Continued spread. • May 10&11: 239 houses burned; 25,000 evacuated. • Mandatory: Los Alamos, White Rock • Voluntary: Española • May 18: 100% contained, 47,650 acres, 5% LANL property • May 18: NMDOH invited CDC to assist: • Mitchell Wolfe, Josh Mott, and C.M. Wood departed May 18th
Española Los Alamos May 11, 2000
CDC Objectives • 1) Assess environmental monitoring data • 2) Assess need for human screening for specific exposures • 3) Perform necessary screening
Environmental monitoring in response to the Cerro Grande Fire • Chemicals and metals (EPA) • 6 sites around LANL, May 12-17. • VOCs, PAHs, pesticides, and metals • Results: very low VOC, PAH, and metals • Particulate Matter (NMED, EPA) • Additional sites and intervals • Española began May 13 • Results: low except elevated PM10 on LANL May 12-13. • Asbestos (NMED) • air/wipe samples in Los Alamos town • Results: Low • Radionuclides (Many agencies) • Results: Some samples contained small amounts of radioactive material, mostly from natural sources, but the concentrations in the samples were several orders of magnitude below any regulatory limit
Potential human exposure • 1,600 firefighters • 1,400 (88%) during May 11-15, when most of LANL burned • Several hundred National Guard, City and State Police • Evacuations • Roadblocks • Traffic control, etc • Residents of Española (pop. 9,000) and environs
Discussion • Metal levels • Some elevated values, but only Ni and U above expected number of elevated values • Neither Ni or U associated with smoke exposure. • Uranium naturally-occurring • History of high natural U in previous water studies in area. • No positive association of metals with smoke exposure • Only exception is cadmium in National Guard, and small mean difference in exposed vs unexposed • Some negative associations (lower mean values in exposed) Difficult Issues • Health effects of “elevated” values • Clinical/public health interface (acute/long-term follow-up)
Limitations and Future Needs • Time interval • Because of time interval (approx 2 ½ weeks) from fire to testing, may be an assessment of background levels in populations • Many factors influence half-life, so difficult to reconstruct dose. • Urine testing • Spot urine performed, but not as accurate as 24-hour urine • Because of issues regarding distribution in the body, measuring urine may not be as accurate a measure as serum or other fluids/tissues • Classification of exposure • No biomarker for smoke exists. Definition of exposure based on presence in a city, or fighting fires, on certain days. May not be specific—need a validated biomarker of exposure.
Respiratory and Circulatory Hospital Admissions Associated with Forest Fires - Montana, July-September, 1999 & 2000 • Charon Gwynn, Joshua A. Mott, Todd Damrow • David Mannino, Stephen Redd • EPI-AID 2001-07
Background • Forest fires in Bitterroot Valley burned approximately 950,000 acres • 24-hour PM10 concentrations reached 300g/m3 • Concerns prompted a request for assistance
Objectives • Quantify county-level admission rates for cardio-vascular and respiratory illness • Compare admission rates based on year and level of exposure
Case Definition • Patients admitted July 1 - September 15, 1999 and 2000 for: • cardiovascular illness (ICD9: 390-459) • respiratory illness (ICD9: 460-519) • Residents of 4 Counties with varying exposure levels
Lewis&Clark Missoula Ravalli Yellowstone