Download
1 / 59
610 likes | 1.06k Vues
Introduction. Risk

E N D
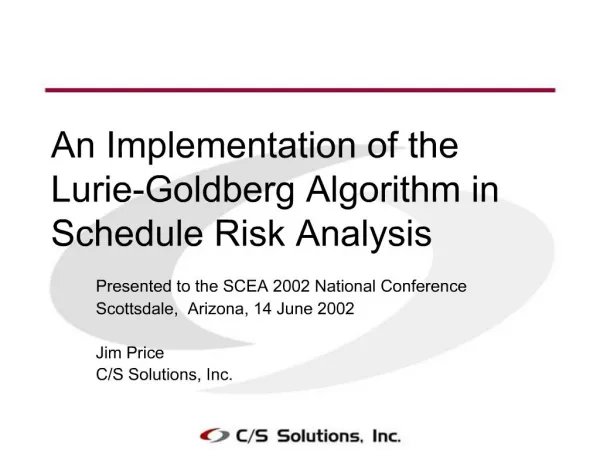
1. Presented to the SCEA 2002 National Conference
Scottsdale, Arizona, 14 June 2002
Jim Price
C/S Solutions, Inc.
An Implementation of the Lurie-Goldberg Algorithm in Schedule Risk Analysis
2. Introduction Risk+� 2.0 is a schedule risk analysis add-in to Microsoft� Project
The product implements the Lurie-Goldberg1 algorithms for generating correlated variables and for adjusting inconsistent correlation matrices
Details follow
4. Schedule Risk Analysis Instead of a single-point estimate for duration, the user supplies:
A three-point estimate
minimum, most likely, and maximum
A distribution curve
uniform, triangular, normal, beta, other
Instead of a single completion date, output is a range of completion dates, with associated probabilities of occurrence
5. A Schedule Without Risk
6. A Schedule With Risk
7. In the presence of risk, each of Design-Code-Test can take on 7200 possible values (in minutes)
Leads to 3.7 x 10¹¹ possible outcomes
Not all are distinct, nor equally likely
We would like to know how they are distributed
Too many to enumerate, so the distribution of finish dates is determined by sampling
Literally, take samples until a clear picture of the underlying distribution emerges Consider the Possibilities
8. Monte Carlo Simulation Select and apply a random (remaining) duration from the specified distribution of each lowest-level task
Recalculate the network
Accumulate summary-level statistics
Repeat until the underlying distribution is revealed
9. Random Number Generation Sampling requires that we generate random numbers from specified distributions
General technique is known as the �inversion method�
Requires only the cumulative distribution function (CDF) of the desired distribution
10. The Inversion Method Pick a random number between 0 and 1
Feed that value to inverse CDF to get random sample from specified distribution
Events �bunch� where the slope of the CDF is large
11. Demo In which the inversion method is shown
Excel (SCEA1.xls)
Risk+ (CORR0.mpp)
12. Are We Done? Yes, if individual tasks are independent
We know how to generate independent random durations for lowest-level tasks
No, if individual tasks are correlated
Durations at lowest level can no longer be generated in isolation
13. Instead of N single-variable probability distributions, we are modeling a single N-variable probability distribution
Our three-point estimates and distribution curves define the marginal distributions of the underlying multivariate distribution
At least, we hope they do
To capture the interrelationships, we also need to specify the correlations among tasks The Problem � In Principle
14. Both plots below show Code vs. Test durations, for the distributions specified
Simple application of inversion method produces the plot on the left � values are uncorrelated
We want the plot on the right � values are correlated The Problem � In Practice
15. What Is Correlation? Literally: co-relation
Two or more variables share a relationship
Mathematically: measures dependence
P(A, B) = P(A) � P(B) + something
If independent, �something� is zero: the joint distribution is just the product of the marginal distributions
16. How Is Correlation Measured? Let me count the ways�
Product-moment (Pearson)
Rank (Spearman, Kendall, �)
Others
Product-moment correlation is the appropriate measure for cost-schedule risk analysis
Durations and costs are interval, not ordinal measures
It arises naturally in the consideration of the variance of sums of random variables, e.g. summary task durations and costs
Whether product-moment correlation can be well modeled by other measures is a matter of debate
17. Covariance of X and Y
= Cov(X, Y) = E[(X - ?x) � (Y- ?y)]
= E[XY] - ?x ?y = Cov(Y, X)
Intimately related to Variance
Var(X) = E[(X - ?x)2] = Cov(X, X)
Scale by standard deviation ? to give the correlation coefficient, ?
?xy = Cov(X, Y) / ?x?y
Product-Moment Correlation
18. Correlation Matrices Suppose M is a k x m vector whose columns Mi are random variables
If we form Vi = (Mi - ?i) / ?i, it follows from the definitions above that
C = (1/k) VTV
is a matrix of correlation coefficients
If Mi are uncorrelated, then C = I, the identity matrix
19. The Cholesky Decomposition For any correlation matrix C, a lower triangular matrix L can be found such that
C = LLT
L is called the Cholesky decomposition of the matrix C
20. Correlations cannot be specified arbitrarily
If two tasks are each correlated with a third, they are necessarily correlated with each other
Mathematically, a consistent correlation matrix is �positive semi-definite�
Eigenvalues are non-negative
Determinants of principal minors are non-negative
Inconsistent matrices are easy to produce
Lurie and Goldberg describe an adjustment procedure for inconsistent matrices Inconsistent Correlation Matrices
21. Matrix Adjustment Procedure Generate a correlation matrix R = LLT for an initial lower triangular matrix L
Calculate the weighted difference between the terms of R and the original matrix C
D = � ?? wij(cij � rij)2
Minimize D by iterating over the terms in L, constrain to ensure unit diagonals in R
The weights W are supplied by the user
Less certain terms should be much smaller than the default value of 1.0
22. Demo In which the Lurie-Goldberg matrix adjustment procedure is shown
Excel (SCEA6.xls)
Risk+ (SCEA.mpp)
23. Fun With Numbers If N is any k x m matrix with standardized, uncorrelated columns, then V = NLT is also in standard form, and NTN = kI
If C is a correlation matrix and C = LLT, it follows that
VTV = (NLT)TNLT = LNTNLT = LkILT = kLLT = kC
Therefore, the columns of V = NLT are correlated according to the matrix C
24. Is V the Object of Our Desire? V = NLT has the desired correlations, by construction
V is in standard form, so mean and standard deviation are easily adjusted
But, unless the columns of N are standard normals, the distributions Vi will not match Ni
Vi = li1N1 + li2N2 +�+ liiNi
A linear combination of normals is itself normal, but this is not generally true
25. Demo In which the desired correlations, but not necessarily the desired marginal distributions, are obtained
Excel (SCEA2.xls)
26. More Fun with Numbers Well, we can generate correlated normals
Recall inversion method � we might be able to do something with correlated uniforms
Easy to generate: just apply the standard normal CDF to our correlated standard normals,
U = ?(NLT)
Then apply desired inverse CDF to U
V = F-1(U) = F-1(?(NLT))
27. The Version-Inversion Method
28. Is V the Object of Our Desire? V = F-1(?(NLT)) has the desired distributions, by construction
Any uniform distribution will work as well as any other as input to the inversion method
But, the transformations are non-linear, so correlations are not necessarily preserved
Once again, the method is exact only for normal distributions
29. Demo In which marginal distributions are preserved, but correlations are not
Excel (SCEA3.xls)
Risk+ (CORR1.mpp)
30. Sampling Variability In any Monte Carlo simulation, variations are expected from run to run
A different subset of the underlying distribution is sampled each time
Sampling variability can be greatly reduced by starting with a �clean� set of normals
Method due to R.C.H. Cheng2 produces completely uncorrelated normals with exactly zero mean and unit variance
31. Sample Results � Un-iterated Method with Full Sampling Variability (0)
32. Sample Results � Un-iterated Method with Reduced Sampling Variability (3)
33. The Lurie-Goldberg Algorithm Developed by Dr. Phillip Lurie and Dr. Matt Goldberg
Iteratively modifies the Cholesky decomposition matrix to achieve the best possible agreement with target correlations
�Basic� and �Modified� implementations
34. Begin as before (version-inversion)
V = F-1(?(NLT))
Calculate the realized correlations R among the columns of V
Calculate a scalar distance D between the realized and target correlations C
D = � ?? (cij � rij)2
(sum taken over super-diagonal terms only)
Minimize D by iterating over the terms in L, constrain to ensure unit diagonals in R Steps of the Basic Method
35. Demo In which the Lurie-Goldberg Basic algorithm is shown
Excel (SCEA4.xls)
Risk+ (CORR1.mpp)
36. Sample Results � Iterated Method without Sampling Variability (1)
37. Modified Sampling Algorithm As noted, a Monte Carlo simulation will experience run-to-run variations
The basic Lurie-Goldberg algorithm iterates out this �natural� variability
Variation appears in solution time, not result
To re-introduce sampling variability, L&G suggest a modified algorithm
For schedule risk analysis, primary advantage is probably greater speed, not greater variability
38. Steps of the Modified Method Run the basic algorithm with a limited number of samples (e.g. 100)
N is constructed to have exactly zero mean and unit variance (again, Cheng�s method)
Use modified decomposition matrix L to generate the full set of samples
Once again, V = F-1(?(NLT)), but with the iterated matrix for L and a full set (e.g. 1000) of uncorrelated normals for N
39. Sample Results � Iterated Method with Full Sampling Variability (2)
40. Sample problem from presentation by Book and Young to 24th DODCAS, Sept 1990
4 skewed triangular distributions
Apparently arbitrary correlations, 0.9-0.5
�Cross check by analytic fit to beta distribution� Comparison of Results by Method (Costs)
42. Implementation Details Custom non-linear constrained optimization routine
Conjugate-gradient method with quadratic penalty terms, some domain-specific enhancements
Similar to Gauss-Newton method analyzed by Lurie and Goldberg
Both are successive line-minimization methods with quadratic convergence
Conjugate-gradient method requires less storage
43. Performance Factors Number of correlations
Minimization routine searches O(m2) dimensions
Number of samples
Distance function requires O(nm2) multiplications and O(nm) marginal distribution calculations per evaluation
Unrealizable problem specification
Results in extended fruitless searching
More likely to be a problem when marginal distributions are far from normal
44. Solution Time is a Random Variable
45. Why All the Fuss? In schedule analysis, the durations of summary tasks are sums of random variables
Variance of sums of random variables is affected by correlation
Var(X+Y) = Var(X) + Var(Y) + 2 � Cov(X, Y)
If Cov(X, Y) > 0, neglecting correlation leads to an underestimate of the standard deviation of summary tasks
46. Demo In which the effect of correlation on summary-level standard deviation is shown
Risk+ (CORRDEMO.mpp)
47. Summary How correlation enters a Monte-Carlo simulation
Lurie-Goldberg adjustment procedure for inconsistent correlation matrices
Non-iterated and iterated (Lurie-Goldberg) methods for generating correlated random variables
Implementation and performance factors
Why correlation matters in schedule risk analysis
48. Addendum -- What about Rank Correlation? Commercial software with rank-correlation capability is often used to model product-moment correlation
Point: Rank correlation is not product-moment correlation, and using it can lead to misleading (if not meaningless) results.
Counter-point: So you say, but it seems to work pretty well. Go figure.
49. How Are These Rank Correlated Numbers Generated? Almost certainly, by an algorithm due to R.L. Iman and W.J. Conover3
But ask your vendor, to be sure
Observation: The Iman-Conover algorithm uses product-moment correlation to approximate rank correlation
Yes, really
50. The Iman-Conover Algorithm Generate a set of uncorrelated normal samples
Multiply by the Cholesky decomposition of the target correlation matrix to produce correlated normal samples
Determine the rank order of the correlated normal samples
Generate uncorrelated samples from any desired set of target distributions
Rearrange the target samples so they have the same rank-ordering as the correlated normal samples
51. Iman-Conover -- Commentary The observed rank correlations will always be approximate
Rank correlation is not product-moment correlation
If the target distributions are normal, the product-moment correlations will be exact (within sampling error)
If the target distributions are non-normal, the resulting product-moment correlations will be inexact, in the now-familiar way
Reordering the target distributions is a non-linear transformation comparable to �version-inversion�
52. Sample Results � Rank Correlations from Iman-Conover
53. Sample Results � Product-Moment Correlations from Iman-Conover
54. The Lurie-Goldberg-Iman-Conover Method (LGIC) Iman-Conover is ultimately based on the Cholesky decomposition
Consequently, the Lurie-Goldberg algorithm is easily extended to incorporate Iman-Conover
Simply substitute IC rank ordering technique for the �version-inversion� method
Calculate observed product-moment correlations and iterate as before
Of course, we could iterate to improve rank correlation just as easily, if desired
55. Sample Results � Product-Moment Correlations from LGIC
56. Sample Results � Rank Correlations from LGIC
57. Demo In which the Lurie-Goldberg-Iman-Conover algorithm is exercised
Risk+ (CORR1.mpp)
58. Comparison � LG vs LGIC For equal number of samples, Lurie-Goldberg (LG) is significantly faster than Lurie-Goldberg-Iman-Conover (LGIC)
For common distributions, it is faster to generate samples than to sort them
But, LGIC supports Latin Hypercube sampling, which can reduce the number of samples required
Not to mention producing prettier distributions
LGIC has an inherent limit in resolution, especially for very small sample sizes
Small refinements to Cholesky decomposition may not result in a new ordering
Effect is unnoticeable unless target correlations are already at the edge of feasibility
59. Summary (of Addendum) The Iman-Conover algorithm for generating rank-correlated samples uses product-moment correlation �under the hood�
Hence its rather unexpected success in modeling product-moment correlations
As with all (Cholesky-based) algorithms, it will be particularly good for normal and near-normal distributions
The Lurie-Goldberg algorithm is easily extended to incorporate the Iman-Conover algorithm
Combined approach is slower than the original for common distributions, but capable of comparable accuracy
Combined approach supports Latin Hypercube sampling
60. Questions? The Excel files used in this demonstration are available on request. Please email jprice@cs-solutions.com