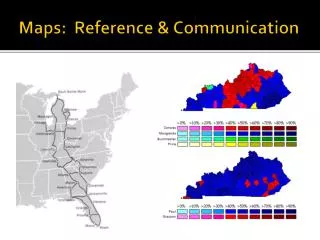
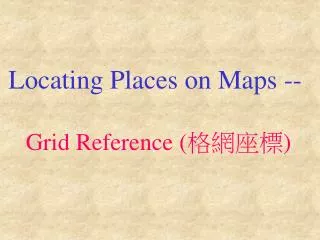
Maps and Grid Reference
Maps and Grid Reference. What is the Ordnance Survey…?. Maps and Grid Reference. Ordnance Survey (OS) is the national mapping agency for Great Britain and is one of the world's largest producers of maps.

Maps and Grid Reference
E N D
Presentation Transcript
Maps and Grid Reference What is the Ordnance Survey…?
Maps and Grid Reference • Ordnance Survey (OS) is the national mapping agency for Great Britain and is one of the world's largest producers of maps. • OS Explorer, (1:25,000) Specifically designed for walkers and cyclists. These are the most detailed leisure maps that Ordnance Survey publish and cover all types of footpaths and most details of the countryside for easy navigation.
Basics of mapping. • To read a map you need to understand compass directions, grid references and the map's key and scale. • You need to be able to find features when given a map reference. • You also need to be able to describe a feature's location on a map by giving a map reference.
Compass directions. • Compass directions are vital for finding your way around a map. • There are many ways to remember where each direction goes. • You probably learnt a rhyme or a phrase to help you remember - if not, here's one now. Starting at the top and moving clockwise the directions on a compass or map are: • 1. North - Never • 2. East - Eat • 3. South - Shredded • 4. West - Wheat
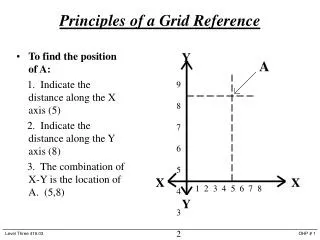
Northings and Eastings • Every map in geography has a series of even vertical and horizontal lines drawn on the map which divide the map into rows and columns of little boxes. • These lines are then numbered, which provides a way of referring to particular places and locations on the map.
Northings and Eastings • Eastings • Eastings are lines that run up and down the map. They increase in number the further you move east (or right). You can use them to measure how far to travel east. • Northings • Northings are lines that run across the map horizontally. They increase in number the further you move north (or up the map). You can use them to measure how far to travel north. NORTHINGS EASTINGS
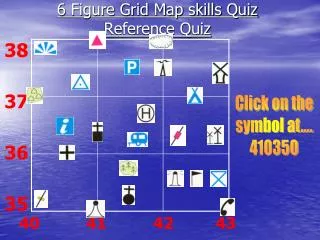
Grid references. • OS maps are divided into numbered squares. • These squares can be used to give a place a four or six-figure grid reference. • It is important that you know both four-figure and six-figure grid references.
Grid references. A simple way to remember how we would write down a grid reference. (Area Reference) Along the corridor and up the stairs!
Grid references. • Numbers along the bottom of the map come first and the numbers up the side of the map come second!
Six Figure Grid Reference. In order to give something a six-figure grid reference, imagine the larger square split into one hundred smaller squares. 26 25 77 78
Six Figure Grid Reference. Then add numbers 1 to 9 between the main lines. 26 9 8 7 6 5 4 3 2 1 25 1 2 3 4 5 6 7 8 9 77 78
Six Figure Grid Reference. The six-figure grid reference for the square would be… 26 9 8 7 6 5 4 253 3 2 773 - 253 1 25 1 2 3 4 5 6 7 8 9 77 78 773
Six Figure Grid Reference. The six-figure grid reference for the square would be… 26 9 258 8 7 6 5 4 3 2 776 - 258 1 25 1 2 3 4 5 6 7 8 9 77 78 776
Six Figure Grid Reference. The six-figure grid reference for the square would be… 26 9 8 7 6 5 4 3 2 778 - 251 251 1 25 1 2 3 4 5 6 7 8 9 77 78 778
Six Figure Grid Reference. The six-figure grid reference for the square would be… 26 9 258 8 7 6 5 4 3 2 775 - 258 1 25 1 2 3 4 5 6 7 8 9 77 78 775
0 22 9 8 7 6 5 4 3 2 1 0 21 0 1 2 3 4 5 6 7 8 9 0 39 40 The Six - Figure Grid Reference for this box is: 39 2 21 7 3) 25 24 46 47 The Six - Figure Grid Reference for this point is:
Answers 1) 397 211 2) 394 236 3) 467 246 4) 435 230 5) 433 249
Map Features • A map is simply a plan of the ground on paper. • The plan is usually drawn as the land would be seen from directly above. • A map will normally have the following features: • The names of important places and locations. • Standard symbols to show the location of key land marks and features. • A key to explain what the symbols on the map mean. • A scale or scale bar to allow you to measure distance on the map and convert it to the actual distance on the land. • A grid system of lines which allows you to pin point your location, orient your map to the land and quickly estimate distances.
Map Features. • There are some basic features that most maps will include: • Roads tend to be marked in different colours depending on the type of road depicted. • Footpaths. • Woods are shown in green with a coniferous on non coniferous tree shape printed over the top. • Buildings are marked by small Black Square. However, some particular buildings have their own special symbols such as churches, towers, and wind mills. Any of these buildings can be useful landmarks helping you to check your position on the map. • Rivers and streams are shown as lines, usually blue, the width of the line is representative of the water course width. Rivers and streams are extremely useful in determining your position on the map. • Scale tells you how much the land has been scaled down to fit on the paper.
Map Scale. • Map Scale: 1:25,000 • One centimetre (cm) on the map is represented on the ground by 250 m. • One kilometre (km) (1,000m) on the ground is represented on the map by 4 cm. • One millimetre (mm) on the map is represented on the ground by 25 m. • Q. How far is 2cm on a map? • A. 500 m • Q. How far is 5cm on a map? • A. 1k 250 m or 1,25k • Q. How far is 2mm? • A. 50 m • Q. How far is 12cm? • A. 3k
Map Key. • On every map you find a Key. • This is a list of conventional signs and symbols which are used to locate natural and man-made features. • The type and number of symbols used on a map will depend on the purpose for which the map is to be used. • The symbols on maps are generally broken into three categories; Dot or Point Symbols, Line Symbols, and Area Symbols or Patterns.
Map Key. • Dot or point symbols are used to indicate the location of features of no significant dimensions relative to the map scale. • Line Symbols indicate a feature with one significant dimension, which is length. They represent features such as rivers, roads, railway lines etc. • Area Symbols or Patterns indicate area covered by particular characteristics such as Urbanized areas or Lakes.
Maps and Map Symbols/Keys. • Using a map can help you visualise in your mind what the place looks like that you are going to. • You can see what landmarks and features you will pass on the way to your destination. • Maps mean you know what to expect, and they help you to know you are going in the right direction to arrive at your destination safely and quickly. • You need to learn all the map symbols/keys from memory! (we will do doing a test on this topic!)
Contour Lines. • A contour line (often just called a "contour") joins points of equal elevation (height) above a given level, such as mean sea level. • A contour map is a map illustrated with contour lines, for example a topographic map, which thus shows valleys and hills, and the steepness of slopes.
Contour Lines. • The ability to understand the shape of the ground from a map is a useful skill to learn. • The height and shape of the ground is shown on 1:25 000 scale maps by brown contour lines. • A contour is a line drawn on a map that joins points of equal height above sea level. • 1:25 000 scale maps the interval between contours is usually 5 metres, although in mountainous regions it may well be 10 metres.
Contour Lines. • The diagram shows the link between the shape of a hill and the contours representing it on a map. • Another way of thinking about contour lines is as a tide mark left by the sea as the tide goes out, leaving a line every 5 metres.
Contour Lines. • To make topographic maps easier to read, every fifth contour line is an index contour. • Because it's impractical to mark the elevation of every contour line on the map, the index contour lines are the only ones labelled. • The index contours are a darker or wider brown line in comparison to the regular contour lines. • You'll see the elevations marked on the index contour lines only. • To determine elevations, pay attention to the amount of space in between lines. • If the contours are close together, you're looking at a steep slope. • If the contours have wide spaces in between (or aren't there at all) the terrain is relatively flat.
Contour Lines. Ordnance Survey maps use contour lines to join points of equal height together. Understanding contours is a very useful navigation skill because you can identify the lay of the land and landscape features as they appear on the ground. They tell you whether the ground is flat, hilly or steep, and whether a route will be a gentle easy walk or a hard uphill slog.
پایگاه پاورپوینت ایران www.txtzoom.com بانک اطلاعات هوشمند پاورپوینت پایگاه پاورپوینت ایران www.txtzoom.com بانک اطلاعات هوشمند پاورپوینت Click to edit Master subtitle style