Discovering Maps: Unveiling the World's Depths and Heights
Explore the diverse types of maps and their significance, learn how to create accurate maps, and delve into different map features like Shaded Relief and Contour Maps. Discover the importance of accurate mapping for global reference and decision-making.

Discovering Maps: Unveiling the World's Depths and Heights
E N D
Presentation Transcript
Maps and Mapping How High or How Low…Can you go?
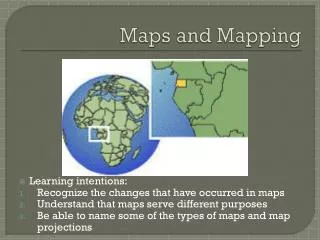
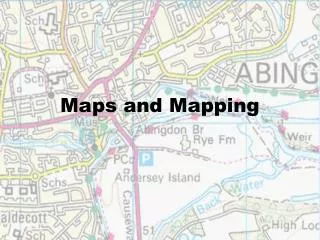
Maps There are many different kinds of maps that are used for many different purposes.
Think about it • What are some of the different kinds of maps that you have seen or used? • Talk with your partner and come up with 5 different types of maps or 5 different things we could map
Different types of maps • Examples of maps • Road or street • Weather • Topographic • Shaded relief
How do you make an accurate map? • Start with a point of reference • Longitude • Imaginary lines • Run north and south but measure EAST AND WEST • Prime Meridian • Latitude • Imaginary lines • Run east and west but measure NORTH AND SOUTH • Equator
Why make accurate maps? • Location • Reference for everyone in world
What must be on ALL maps • Scale • Legend • Location/title • Key • Longitude/latitude • Magnetic declination
Types of maps a geologist would use • Shaded Relief • Topographic or Contour
Shaded Relief Map • A shaded relief map is designed to highlight the physical features of an area of land. • It shows relative elevations. • This kind of map shows height through shading and coloring variations.
Contour Maps • A contour or topographic map shows the elevation of the land at all points. • It can be used to calculate the absolute elevationof any given place. • This kind of map shows height variations through the use of contour lines.
Contour Lines • Contour lines are imaginary lines that connect points of equal elevation. • The contour interval or change in elevation from one contour line to the next is always consistent.
Contour Lines • Hills are indicated by closed contours. • Depressions or large dips are indicated by closed contours with hachure lines that point downhill.
Contour Lines • The spacing between contour lines shows the gradient. • Closely spaced lines indicate a steep slope. Contours spaced far apart represent gentle slopes.
“Check Point” • Which is higher, hill A or hill B? • Which hill is steeper? • How high is the area between the hills?
Here is the same contour map along with a cross section diagram of the area...
“Check Point” Match the cross-sections on the left with a contour map on the right...
Answers... 1 - B 2 - E 3 - D 4 - C 5 - A
“Think About It” How might a contour (topographic) map be of assistance if you were: • planning a housing development... • building a road... • choosing which hiking trail to take... • selecting where to put a new airport...