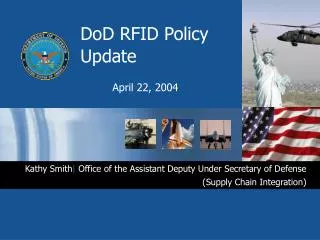
DoD Supply Chain Integration Performance Metrics using RFID April 8, 2008
DoD Supply Chain Integration Performance Metrics using RFID April 8, 2008. Demonstrate how passive RFID… Captures precise measurement of materiel flow Identifies potential opportunities for improvement Improved business processes (Lean Six Sigma approach) Timely system updates. Objective.

DoD Supply Chain Integration Performance Metrics using RFID April 8, 2008
E N D
Presentation Transcript
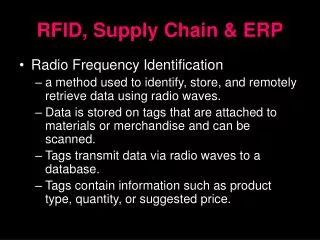
DoD Supply Chain Integration Performance Metrics using RFID April 8, 2008
Demonstrate how passive RFID… Captures precise measurement of materiel flow Identifies potential opportunities for improvement Improved business processes (Lean Six Sigma approach) Timely system updates Objective
Fort Richardson, AK Elmendorf AFB, AK Travis AFB, CA DDJC Commercial Truck Military Aircraft Commercial Ship Using RFID to highlight opportunities for improvement The Alaska RFID Project Cross-Service implementation of passive RFID technology along multiple supply chain segments at select Department of Defense (DoD) sites (DDJC, Travis, Alaska) • Objectives of Alaska Project • Determine how to automate processes with passive RFID technology & execute RFID enabled processes • Determine how to make ITV data available through DoD enterprise capabilities (e.g. DAAS, IDE, AV) • Identify business process re-engineering opportunities • Quantify the financial benefits
RFID provides a new data point - revealing actual materiel movement more discretely for the first time Continuous Process Improvement (CPI) We need to understand this gap Root cause analysis Actual Movement of Materiel System Transaction RFID Middle-ware Logistics System Issue Identification Identify issues with the process between these two points Accurate measurement
The new RFID data point provides additional insight within the response time segments Transportation / Theater Time Storage Depot Time Shipment Transaction Shipment Transaction Receipt Transaction Departure Departure Arrival Retail Logistics System RFID Middle-ware RFID Middle-ware RFID Middle-ware Logistics System Logistics System Retail Facility Trans-shipment Point Distribution Depot
RFID reveals potential areas for improvement at the Container Consolidation Point The average time to build a container load at the CCP was over 3 days In-transit to the Customer Transportation Time System transaction indicating truck departure Materiel loaded onto the truck trailer RFID Middle-ware Logistics System The average time to build a container was variable Average = 3.33 days
RFID reveals potential areas for improvement at the retail sites Site A had an average receipt posting of 0.3 days. Site B had an average receipt posting of 8.5 days. The new data makes this process visible for analysis. Transportation Time Actual Arrival of Materiel (Visibility Transaction) System Receipt Transaction Retail Logistics System RFID Middle-ware Opportunity: Reduce receipt take-up time Business Benefits: Materiel to the customer more quickly, Increased throughput
RFID reveals potential areas for improvement at retail sites when there is no system receipt at DAASC Identify issues with the process No System Transaction in DAASC X Actual Movement of Materiel RFID Middle-ware • Many requisitions to the Alaska sites did not have a system receipt at DAASC*: • 19% of the requisitions going to Ft. Richardson • 26% of the requisitions going to Elmendorf AFB *Requires additional causative research: - Receipted in local AIS but not sent to enterprise level? - Not receipted in local AIS or at enterprise level? Sep-Nov 2007 requisitions reviewed in Jan 08. Metrics are based on a statistical sample - 95% confidence with a variation of ±6.5%.
95 – 97% of requisitions were visible at the local site via RFID or FEDEX, despite not having a system receipt at DAASC Type of visibility at Ft Richardson Type of visibility at Elmendorf AFB Sep-Nov 2007 requisitions reviewed in Jan 08. Metrics are based on a statistical sample - 95% confidence with a variation of ±6.5%.
Closing receipts in a timely manner produces business benefits Including requisitions not received, the response time measurement grows from an average of 8.5 days to 28.9 days. Transportation Time Actual Arrival of Materiel (Visibility Transaction) System Receipt Transactions averaged 8.5 days Time of the Analysis (No receipt in Systems yet) RFID Middle-ware Retail Facility Opportunity: Reduce LRT by eliminating erroneous supply receipt discrepancies Business Benefits: Reduce erroneous losses, Avoid possible reorders
Estimating a potential business benefit – avoiding reorders 22% of requisitions from DDJC to Alaska sites were never received at DAASC. • After the expected arrival date, 30.1% of those requisitions had a subsequent requisition by the same unit ordering the same or greater quantity of the same NSN • The POSSIBLE reorders represent 7% of the entire number of requisitions sent to Alaska in same timeframe (June – Sep 2007) • Transportation Savings • Inventory Reduction Not Received Materiel that Arrived Original Request: Requisition A NSN # 123 Alaska Customers DDJC Reorder Reordered Request: Requisition B NSN #123 * Requires additional analysis of demand data to confirm if reorders occurred Analysis June 2007 – September 2007Metrics are based on a statistical sample - 95% confidence with a variation of ±6.5%.
TDD Target RFID reveals precise materiel movement, enabling Lean Six Sigma process analysis * RFID LRT Mean = 32 days STDev = 17.5 days *System LRT Mean = 43.5 days STDev = 24 days 68% of Issue Priority Group 3 requisitions actually arrive within the defined Time Definite Delivery (TDD) target of 37 days compared to 56% of system receipts.
Potential improvements will have a cumulative effect across the DoD Supply Chain Transportation / Theater Time Storage Depot Time Shipment Transaction Shipment Transaction Receipt Transaction Departure Departure Arrival Retail Facility Trans-shipment Point Distribution Depot 8 day improvement* 2 day improvement* 1 day improvement* 11 day improvement* *days improvement are examples only
Passive RFID provides a new data point Captures precise measurement of materiel flow Identifies potential opportunities for improvement Improved business processes (Lean Six Sigma approach) Timely system updates Initial implementations at small sites yield an opportunity for improvement Analysis team will continue to work with the Services to enable them to complete, and expand upon, the analysis Summary