Download
1 / 22
220 likes | 861 Vues
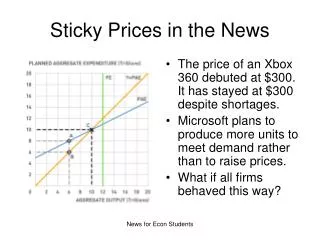
9.1. STICKY PRICES AND THEIR MACROECONOMIC CONSEQUENCES. short run in macroeconomics The period of time in which prices do not change or do not change very much. 9.2. UNDERSTANDING AGGREGATE DEMAND. What Is the Aggregate Demand Curve?.

E N D
9.1 STICKY PRICES AND THEIR MACROECONOMIC CONSEQUENCES • short run in macroeconomicsThe period of time in which prices do not change or do not change very much.
9.2 UNDERSTANDING AGGREGATE DEMAND • What Is the Aggregate Demand Curve? • aggregate demand curve (AD)A curve that shows the relationship between the level of prices and the quantity of real GDP demanded. • FIGURE 9.1Aggregate Demand
9.2 UNDERSTANDING AGGREGATE DEMAND • The Components of Aggregate Demand Why the Aggregate Demand Curve Slopes Downward As the purchasing power of money changes, the aggregate demand curve is affected in three different ways: THE WEALTH EFFECT • wealth effectThe increase in spending that occurs because the real value of money increases when the price level falls. THE INTEREST RATE EFFECT THE INTERNATIONAL TRADE EFFECT
9.2 UNDERSTANDING AGGREGATE DEMAND • Shifts in the Aggregate Demand Curve Key factors that cause the shifts: CHANGES IN THE SUPPLY OF MONEY CHANGES IN TAXES CHANGES IN GOVERNMENT SPENDING ALL OTHER CHANGES IN DEMAND
9.2 UNDERSTANDING AGGREGATE DEMAND • Shifts in the Aggregate Demand Curve ALL OTHER CHANGES IN DEMAND • FIGURE 9.2Shifting Aggregate Demand
9.2 UNDERSTANDING AGGREGATE DEMAND • How the Multiplier Makes the Shift Bigger • FIGURE 9.3The Multiplier • multiplierThe ratio of the total shift in aggregate demand to the initial shift in aggregate demand. • consumption functionThe relationship between the level of income and consumer spending. C = Ca + by
9.2 UNDERSTANDING AGGREGATE DEMAND • How the Multiplier Makes the Shift Bigger • autonomous consumption spendingThe part of consumption spending that does not depend on income. • marginal propensity to consume (MPC)The fraction of additional income that is spent. • marginal propensity to save (MPS)The fraction of additional income that is saved.
9.2 UNDERSTANDING AGGREGATE DEMAND • How the Multiplier Makes the Shift Bigger
9.3 UNDERSTANDING AGGREGATE SUPPLY • The Long-Run Aggregate Supply Curve • aggregate supply curve (AS)A curve that shows the relationship between the level of prices and the quantity of output supplied. • long-run aggregate supply curveA vertical aggregate supply curve that represents the idea that in the long run, output is determined solely by the factors of production. • FIGURE 9.4Long-Run Aggregate Supply
9.3 UNDERSTANDING AGGREGATE SUPPLY • The Long-Run Aggregate Supply Curve DETERMINING OUTPUT AND THE PRICE LEVEL • FIGURE 9.5Aggregate Demand and the Long-Run Aggregate Supply
9.3 UNDERSTANDING AGGREGATE SUPPLY • The Short-Run Aggregate Supply Curve • short-run aggregate supply curveA relatively flat aggregate supply curve that represents the idea that prices do not change very much in the short run and that firms adjust production to meet demand. • FIGURE 9.6Aggregate Demand and Short-Run Aggregate Supply
9.3 UNDERSTANDING AGGREGATE SUPPLY • Supply Shocks • supply shocksExternal events that shift the aggregate supply curve. • FIGURE 9.7Supply Shock • stagflationA decrease in real output with increasing prices.
9.4 FROM THE SHORT RUN TO THE LONG RUN • FIGURE 9.8The Economy in the Short Run
9.4 FROM THE SHORT RUN TO THE LONG RUN • Looking Ahead • FIGURE 9.9Adjusting to the Long Run
aggregate demand curve (AD) aggregate supply curve (AS) autonomous consumption spending consumption function long-run aggregate supply curve marginal propensity to consume (MPC) marginal propensity to save (MPS) multiplier short-run aggregate supply curve short run in macroeconomics stagflation supply shocks wealth effect
1 What does the behavior of prices in retail catalogs demonstrate about how quickly prices adjust in the U.S. economy? Price Stickiness in Retail Catalogs 2 How can changes in demand cause a recession? In particular, what factors do economists think caused the 2001 recession? Business Investment, Net Exports, and the 2001 Recession 3 Do changes in oil prices always hurt the U.S. economy? How the U.S. Economy Has Coped with Oil Price Fluctuations
BUSINESS INVESTMENT, NET EXPORTS, AND THE 2001 RECESSION APPLYING THE CONCEPTS #2:How can changes in demand cause a recession? In particular, what factors do economists think caused the 2001 recession? To determine what caused the 2001 recession and how it differed from past recessions, economist Kevin Kliesen of the Federal Reserve Bank of St. Louis compared data for recessions over time. Kliesen found that spending on consumer durables and new residential housing production decreased. • However, during the 2001 recession spending on consumer durables and new housing production both grew throughout the recession. Instead, business investment and net exports dropped. • Investors and firms realized that the economic boom times of the late 1990s were over. • Net exports fell for two reasons: • World economic growth slowed. • The value of the dollar increased relative to foreign currencies, making U.S. goods more expensive.
Extra Application 4 RETAILERS REPORT MIXED FEBRUARY SALES • February retail sales results were mixed with 59 percent of the nation’s retailers missing expectations and 41 percent exceeding expectations. The winners were the large discount stores like Wal-Mart and Target with the specialty shops like The Gap and Abercrombie and Fitch Co. losing ground. The Sharper Image Corporation experienced a 31 percent drop in same store sales. • Some economists worry that consumer spending could slow since the overall savings rate is negative. • Consumers are spending more than they are making indicating additional borrowing or dipping into savings. • Can consumers continue to spend? If consumer spending continues to decline we will see a permanent shift to the left in aggregate demand. If the government or business sectors increase spending enough to offset the consumer reduction there will be no change. If the change is permanent we should see the price level fall a little, ceteris paribus. If the Fed sees the same pattern, it should signal the end of interest rate increases.
Extra Application 5 GLOBAL WARMING VS. ECONOMIC GROWTH • According to Nicholas Stern, the former chief economist for the World Bank, global warming will ultimately result in a global depression with output falling more than 20 percent. Additionally, many of the planet’s coastal cities will be under water. Stern advocates massive government intervention in order to curb greenhouse gas emissions and prevent the environmental disaster. • Robert Samuelson maintains that there are no economically feasible and/or politically acceptable ways to cut greenhouse gases. • Samuelson states that it would require all countries, rich and poor alike, to pledge to reduce emissions and actually follow through on those pledges. • Samuelson also maintains that the subsequent economic slowdown associated with curbing emissions might be worse than the unknown impact of global warming. Note that the imposition of a tax on emissions would shift the AD curve to the left. A tax reduction would have the opposite impact and increase AD.
HOW THE U.S. ECONOMY HAS COPED WITH OIL PRICE FLUCTUATIONS APPLYING THE CONCEPTS #3:Do changes in oil prices always hurt the U.S. economy? • During the 1970s, the world economy was hit with unfavorable supply shocks that raised prices and lowered output, including spikes in oil prices. • Increases in oil prices shift the aggregate supply curve. However, they also have an adverse effect on aggregate demand. • Because the United States is a net importer of foreign oil, an increase in oil prices is just like a tax that decreases the income of consumers. • An increase in taxes will shift the aggregate demand curve to the left. • Between 1997 and 1998, the price of oil on the world market fell from $22 a barrel to less than $13 a barrel. The result: gasoline prices were lower than they had been in over 50 years. • In 2005, oil prices shot up to $60 a barrel. • Reason: increased demand throughout the world, particularly in fast-growing countries such as China and India. • Result: the economy appeared to absorb these price increases without too much difficulty. Price increases did not have adverse effects on aggregate demand as in prior years.
PRICE STICKINESS IN RETAIL CATALOGS APPLYING THE CONCEPTS #1:What does the behavior of prices in retail catalogs demonstrate about how quickly prices adjust in the U.S. economy? • To analyze the behavior of retail prices, economist Anil Kashyap of the University of Chicago examined prices in consumer catalogs. • He looked at the prices of 12 selected goods from: • L.L. Bean • Recreational Equipment Inc. (REI) • The Orvis Company, Inc. • The goods included shoes, blankets, chamois shirts, binoculars, and a fishing rod and fly. • What did he find? • Considerable price stickiness. • When prices did change, he observed a mixture of both large and small changes. • During periods of high inflation, prices tended to change more frequently.