Download
1 / 44
440 likes | 827 Vues
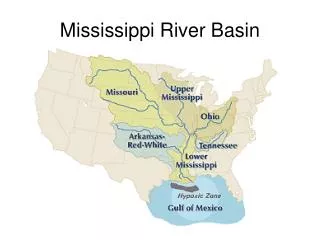
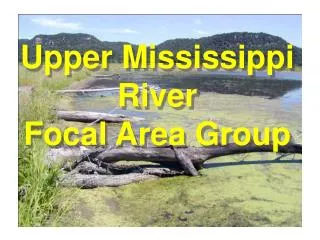
Upper Mississippi River Focal Area Group. Problem Statement: How much floodplain forest, wetland and riverine habitat do we need to conserve viable populations of the 10 focal species selected for the Upper Mississippi River ? Secondary Consideration:

E N D
Problem Statement: How much floodplain forest, wetland and riverine habitat do we need to conserve viable populations of the 10 focal species selected for the Upper Mississippi River? Secondary Consideration: What landscape configuration would most efficiently and effectively conserve viable population of the species.
Our Planning Area Pool 13
Minneapolis/St. Paul Rock Island Pool 13 St. Louis
Structured Decision Making Conceptual Units Actions Change LC acres Biological Model Biological Model Objectives Population persistence
Evaluating Actions • Create a suite of potential actions • Change current land cover in a variety of ways • Compare each action • Choose action that minimizes the costs relative to benefit
The Process • Regional Species of Concern (RCP) occurring on the UMR were considered • Species limited by habitat were considered as a subset of the RCP list • Used additional criteria (e.g. species detectability, species representative of various habitats of interest, trust resource status, ….) to narrow the list down to 10 species • Population objectives for each species were developed
The Process (Alternative Landscape Development) • Six Habitat Needs Assessment (HNA) habitat types were selected and existing acreages were identified • Four alternative landscapes were proposed; the corresponding habitat acreage changes under each alternative were listed in a table • Costs for each management action (habitat conversion) were estimated
Example HNA Matrix Habitat 1 = X acres Habitat 2 = X acres Habitat N = X acres Sp 1 1 0 3 Sp 2 0 2 1 Sp 3 0 0 3 Sp N 2 1 1 Figure the number of acres needed to support 1 breeding pair/staging individual
The Process: How do we establish population objectives at a regional scale and step them down to a local scale? • For species where national population objectives exist, (e.g. for birds use Joint Venture population objectives) step down that national objective to the smaller area (top down approach); • For species where we do not have a national or regional objective: Taking the best scientific information available about a species, considering our values (the Service interest in that species; e.g. RCP list), and what we want to happen with that species (increase, decrease, stable), estimate the scale-dependent population objective. • Eventually we want a Regional objective for each species that we can step down to smaller scales
The Process (Continued) • Population objectives were converted to a relative ranking for a combination of all species and used in a rapid prototype model and for comparison of the potential alternatives and eventual selection of the preferred alternative • Species sensitive to the management actions were identified and selected for monitoring • Monitoring/evaluation metrics were identified (these need to relate to the objectives). • Hierarchy of choice for population monitoring: • Gross population measure (assuming we can get this information with the same level of effort as getting relative abundance or if the species is rare and of special interest (e.g. endangered)) • Relative abundance • Vital rate
Note: • Initially used extinction risk (P(E)) in lieu of Population Objectives and we set a minimum P(E) limit that we wanted to bring our at risk species of concern toward and, for other species that are ok, as a level that we don’t’ want them to fall below as a result of our management actions. • We converted the amount of habitat to a number of species with an associated extinction risk. • More likely measure in the next iteration of the model would be population estimates for the selected focal species
Selecting Focal Species • List species in the region of interest • Develop selection criteria: Policy relevant, technical merit, practicality, related to habitat condition or availability • Take out the most rare and most ubiquitous (if they won’t allow you to be discretionary) • Could use SMART (ranking) or portfolio selection process • Output: Subset for analysis (modeling)
Example Species Selection Matrix Criteria Sps Policy Tech merit Practical Sp1 Sp2 …… Sp3 Spn
Considerations in the Selection of Species for Monitoring: • Start with a list of focal species • Run through the model to see which species show a response to management (sensitivity to management actions)
Considerations in the Selection of Species for Monitoring: 3. Detectability (ease of and cost) for monitoring it. 4. Uncertainty about a particular species limits our ability to chose among alternative actions. We then use the focal species for monitoring how well our observations at t1 meet our model predictions at t1 (i.e. meet our objectives)
Focal Species Least Tern American Bittern Black-crowned Night Heron Paddlefish Canvasback Beaver Red-headed Woodpecker Prothonotary Warbler Sm. Mouthed Salamander Pileated Woodpecker
Determination of Animals per acre Assumptions: • “Equal” value whether migrant or resident • Homogenous distribution within habitat type • Converted to acres per individual
Range Carrying Capacity from online Ambystomid species HSI model. “Based on local information, the current estimate of the maximum number of long-toed salamanders per optimal hectare is 25. “ Example:Smallmouth Salamander
Extinction Probability 1 Example: If we have 70 breeding pairs we can calculate the probability of extinction = 0.9 [P(E)=Slope*#Individuals+1] P (Extinction) 0 0 50 100 200 No. of Individuals/prs
Varying Extinction Probability for Different Landscapes 1 L1 L2 P (Extinction) L3 Potential Landscapes L4 0 No. of Individuals
1 L1 Where we don’t know the size of a species population we can choose a population range to determine probability of extinction L2 P (Extinction) L3 0.5 0.2 L4 0 1000 2000 0 No. of Individuals
Model Assumptions • All habitat within one cover type is of equal biological value • If we convert one habitat to another, the conversion is instantaneous (no successional stages) • The level of biological information for different species varies • All species were given equal weight (i.e. no weighting)
Habitat Patch Clustering for Least Bittern Warner colors equate to clustered, larger patches
Lessons Learned • Use of estimates resulted in higher animal numbers than would reasonably be expected or observed. • Approach valid, but need species expert input. • Helped understand the model framework. • Literature sources noted carrying capacities in optimal habitats.
What we would do in a second prototype? • Revise our population goals (from extinction risk to a measure of abundance or some other measure [nest success/recruitment, population estimate]). • We did the “How much” in this model. In the next we would incorporate GIS to explore the “Where” and possibly modify the alternatives based upon this (e.g. Least Bittern example map). • Think about how the model output would be implemented by the field. How do we allocate habitat changes on the landscape? • Formalize criteria for selecting which species to monitor in situations where you can’t do it all (e.g. monitor spp. sensitive to change). • Have subject experts participate
What we have learned about SHC?? • Not any one group will complete the SHC framework but we have a better understanding of the framework. • To enter the model world of rapid prototyping, we must not be overly concerned with only using real world data • Short term deadlines add urgency to addressing a problem and help avoid getting bogged down in very specific or precise data during rapid prototyping • A large team (e.g. >8 people) is too large and if the team is that large, tasks need to be allocated to smaller subgroups for completion
What we have learned about SHC?? • For multi-species prototyping, we need to simplify our models more than if we are dealing with just one species • Selection of focal species is very important • Must be clear what objectives are • Metrics/Scale are critical to understand • More upfront training • Approach valid, but need species expert input. • Helped understand the model framework.
Where do you see this group going? Limitations/Challenges • reallocation of staff time away from current priorities • lack of “resources” dedicated to SHC … no one “owns” this • needs to be driven by a clear purpose/need … • need to change how we do business – have established procedures (CCP) directed by Congress • partners may/will be resistant to commit to this …
Where do you see this group going? Limitations/Challenges • field perception of what this is … a way of thinking or the way we will do business • takes time to build capacity to deliver this process … can’t implement this over night or within a short time frame • perception that this is a “directive” from on high
Where do you see this group going? Opportunities • Influence others (COE, NRCS) • MDOC is moving in this direction already • Partners are looking for leadership in conservation planning • Process is good … pieces of this are happening but in a piecemeal way (adaptive management, objective setting process for NESP)
Where do you see this group going? Opportunities • SHC is a very important/powerful tool to help influence what happens on the landscape … FWS has a leadership role in this • adds value to our day to day approach to our work Recommendations • See individual feedback forms
Training Recommendations for Region 3 • Intro to modeling class (ECS3149) – very good, need to understand modeling to more effectively participate in SHC • Structured decision making – need to understand decision making to more effectively participate in SHC • Adaptive Management training – need to understand to more effectively participate in SHC • Rapid prototyping – helps to work through the SHC process (helps at all stages of the circle) • Short course on SHC to familiarize others with SHC
Recommendations for Region 3 - SHC • We are already doing this, to some extent, on the UMR further dictation by RO would be counterproductive • Support/recognize where SHC is occurring - UMR, Missouri River?, Prairies – reward/incentivize continued good work • Seek cooperation/participation from Partners (provide training to other agency leaders/key players) • Provide population objectives for RCP species – applicable to the question of “where do we fit” • Establish the clear purpose (product driven) for SHC on the UMR • We now know more than RO/WO about SHC we will be waiting to see a real commitment from above to SHC
Thanks to all the SHC Coaches and SDM Consultants this week and especially to Donna!!!!!!!