Past warming and ragweed season
Past warming and ragweed season. US National Climate Assessment, 2014. Today ’ s 1 billion at risk for hunger could double by mid-century. Future summers warmer than warmest on record. Battisi and Naylor, Science 2009. Climate Variability and Change. precipitation.

Past warming and ragweed season
E N D
Presentation Transcript
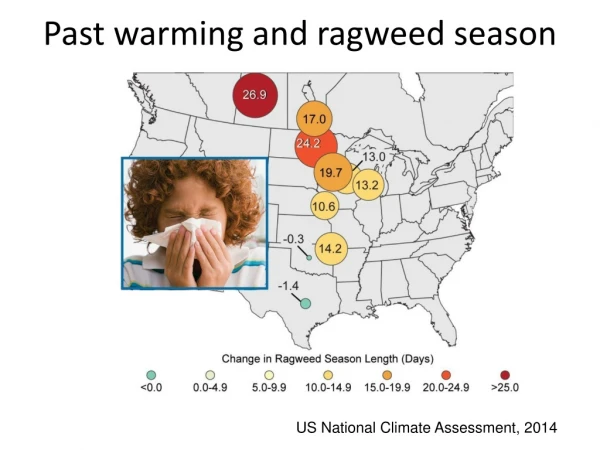
Past warming and ragweed season US National Climate Assessment, 2014
Today’s 1 billion at risk for hunger could double by mid-century. Future summers warmer than warmest on record Battisi and Naylor, Science 2009
Climate Variability and Change precipitation
In Future, when it rains…it will pour. By mid-century, Chicago region may experience 50-120% increase in CSO events (Patz et al. 2008) Globally Averaged U.S. CCSP, 2008
At least 24 died in landslide on March 22, 2014, north of Seattle March, 2014, was the wettest in history for Seattle
Climate Variability and Change Sea level rise
Sea level affecting US populations Schneider & Curtis, 2011
Adaptation and Mitigation Opportunities for health “co-benefits”
Reducing fossil fuel use:An opportunity for improving health We can reduce: The 3 million annual deathsfrom urban air pollution The loss of 3.2 million deaths, from physical inactivity Global Burden of Disease Report, 2013
Benefits of cleaner energy:$200*/ tCO2 • Cost of cleaner energy: < $30/ tCO2 WHICH NUMBER IS BIGGER??? (* Range: $50 to $380) For E. Asia, co-benefits are 10 to 70 times greater West et. al. 2013
20% fewer car trips:Change in O3 & PM 2.5 Grabow et al (2011)
>500 lives saved/yr • 100,000s of Hospital admissions avoided • >$4 billion in avoided mortality and health care costs 20% fewer car trips:Change in O3 & PM 2.5 And if those short trips (< 5 mi. round-trip) were done by bicycle, the fitness benefit would save >700 lives /yr and another $4 billion dollars in avoided mortality costs Grabow et al (2011)
Active Transportation, Diabetes National Walking and Bicycling Alliance 2014
Active Commuting and Health--Evidence Shows: • U.S. cities with enhanced levels of active transport experience health benefits obesity and diabetes rates 20% and 23% lower (Pucher et al. 2010) • Active commuting in Finland reduces 10-year risk of chronic heart disease events (Hu et al. 2007) • High levels of active commuting in China result in reduced risk of colon cancer (Hou et al. 2004) • Active Commuting has a protective effect on cardiovascular outcomes, including mortality, coronary heart disease incidents, stroke, hypertension, and diabetes (Hamer et al. 2008) • San Francisco Bay Area study found increasing biking and walking by 20 minutes/day would reduce cardiovascular disease and diabetes by 14% and decrease (Maizlish et al. 2013)
Dec. 2015 is fast approaching Thank you. Jonathan Patz, Director patz@wisc.edu COP 21 to take place in Paris