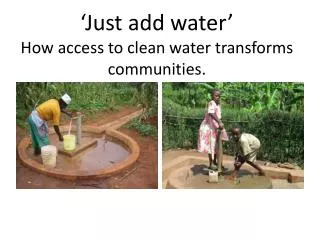
IFC Global Clean Water Access Survey
330 likes | 482 Vues
Team Planning Meeting Washington, DC June 9, 2008. IFC Global Clean Water Access Survey . Joe Brown , University of Alabama Thomas Clasen , London School of Hygiene and Tropical Medicine Tom Outlaw , Kenan-Flagler School of Business, University of North Carolina

IFC Global Clean Water Access Survey
E N D
Presentation Transcript
Team Planning Meeting Washington, DC June 9, 2008 IFC Global Clean Water Access Survey Joe Brown, University of Alabama Thomas Clasen, London School of Hygiene and Tropical Medicine Tom Outlaw, Kenan-Flagler School of Business, University of North Carolina Mark Sobsey, University of North Carolina School of Public Health Simon Spooner, Atkins Global Consultants (UK) Kari Leech, University of North Carolina School of Public Health Jianyong Wu, University of North Carolina School of Public Health
Agenda • Team Introductions & Background • Project Scope • Phase I: Survey • Phase II: Investment Options • Focus Countries • Kenya • China • India • Communicating Findings • Translating knowledge into action • Timeline and deliverables
Ex-ante Assumptions • Access to safe water in developing countries is limited by scale of existing programs • Investment opportunities exist for promising technologies and/or delivery models • Scale & sustainability can be achieved without long-term subsidy
Scope • Technologies and delivery models for scaling up • Point-of-use/household-scale technologies • produce improved water based on WHO risk-based criteria • Commercial models • multinationals/domestic manufacturers/licensees/entrepreneurs • Financing strategies • microcredit/loan guarantees/equity investment
Scope, cont’d • Focus on economically-viable solutions with potential to scale, given targeted investment • Include technologies from Europe/N. America/elsewhere suitable for lower-income countries/market segments
PUR Water Additive Ceramic Water Purifier Plastic Biosand Filter
Phase I • Project Survey: • assess technologies and delivery models in focus countries • based on front-end research & in-country interviews/data • Target Markets: • urban/peri-urban/rural • lower-income/Base of Pyramid • Target Technologies: • disinfection/filtration/hybrid • Provenance: • locally-developed/imported/licensed/hybrid • Delivery models and organizations: • 100% commercial/private sector • public-private partnership • 100% subsidy (gov’t/NGO) • Vended safe water, decentralized technologies
Data Collection Detailed program-specific data on… • Region/Country • Water/water technology supplier name and type (NGO/business) • Target market: geography (urban/rural/peri-urban, on/off grid) • Target market: income (high/medium/lower) • Target intervention (POU/micro-utility water supply) • Technology description • Business model description • Value proposition (cost, quality, convenience) • Cost per liter to supplier (COGS) • Consumer cost per liter • Subsidy (or profit) per liter • Subsidy structure • Track record (profitability and growth rate) • Barriers to growth • Tools available to IFC
Phase II • Goal: Develop commercial-viability profiles of promising technologies & delivery models • Prospective criteria: 1. Technology well-characterized re effectiveness & health impact • or a local adaptation with strong evidence of local viability 2. Economically-sustainable business model • a sound cost-recovery & reinvestment plan, without hardware subsidies 3. Well-developed supply chain (or potential, with targeted investment) 4. Technologies must be scale-able • And have a plan in place for scaling up coverage to maximize access to safe water at the country level
Goal: Increasing Coverage Through Targeted Investment • 3 approaches: • Invest in microfinance mechanisms (demand & supply side) • Equity investment in companies marketing effective safe water products (supply side) • Investment in companies with broad market reach to also manufacture/distribute safe water products (supply side)
Country-specific plans: Phase I survey • Kenya & Uganda • China • India • Chosen because: • Transition economies with emerging markets for safe water technologies • Opportunities for investment and scaling-up • Low access to safe water, particularly rural areas • High incidence of diarrheal/waterborne disease
Kenya • Pop: 36.5m (2006), 59% rural • GNI per capita (2006): US$580 • GDP per capita growth rate (1990-2006): 0% • % population < US$1/day (1995-2005): 23% • Access to improved water (2004): 61% • 28% with household connections • Access to sanitation (2004): 43%, 4% with household connections
Uganda • Pop: 16.8m (2006), 88% rural • GNI per capita (2006): US$300 • GDP per capita growth rate (1990-2006): 3.1% • % population under US$1/day (1995-2005): 85% • Access to improved water (2004): 60%, 1% with household connections • Access to sanitation (2004): 43%, 1% with household connections
Kenya (& Uganda) Country Contacts Manufacturing Trojan UV Chujio Ceramics Vestergaard-Frandsen Kentainers, Inc. Financing K-Rep FINCA BRAC Aga Khan Agency for Microfinance NGOs Kenya Water for Health Organization (KWAHO) NETWAS International, Kenya African Peri-Urban Community, Kenya Donors WSP, IFC, GTZ, USAID
China • Pop: 1.31 bn (2004), 60% rural • GNI per capita (2006): US$2010 • GDP per capita growth rate (1990-2006): 8.8% • % population under US$1/day (1995-2005): 10% • Access to improved water (2004): 77%, 69% with household connections • Access to sanitation (2004): 44%, 22% with household connections
China • Existing partners and contacts • Kenan Institute Asia • Chinese Ministries of Environment and Water Resources • DfID-China • Approaches • Identifying private sector partners with national market access and potential for scale-up; many manufacturers of safe water technologies exist • Obstacle: most have not been independently verified for effectiveness • Few have national reach, many for export • Microfinance institutions for rural and urban markets
India • Pop: 1.15 bn (2006), 72% rural • GNI per capita (2006): US$820 • GDP per capita growth rate (1990-2006): 4.5% • % population under US$1/day (1995-2005): 34% • Access to improved water (2004): 86%, 19% with household connections • Access to sanitation (2004): 33%, 9% with household connections
India • Existing partners and contacts • AED • Institute of Technology, Bombay • PATH • National Institute of Communicable Diseases, India • CARE/ACCESS • Hindustan Lever • Approaches • Microfinance investments to facilitate access to popular filter lines: • Eureka Forbes: tabletop filters • Usha Brita • Unilever • Connecting and mobilizing Women’s Self Help Groups (SHG) • National-level retailers who have access to urban and rural markets with interests in health products, safe water products, consumables
Promising Technologies and Actors: • Identify partners with key technologies and Base Of Pyramid markets • Vestergaard-Frandsen (LifeStraw) • Proctor and Gamble (PUR) • Stefani/Pozzani/Katadyn/Doulton ceramic filters • NGOs with business models & private-sector approaches • e.g., Cambodian ceramic water filter scale-up by IDE • Local entrepreneurs with potential for market entry
Communicating Findings • Connecting investors with opportunities • Post-project dissemination event in Washington DC • Final report • 3 or 4 most-promising projects • their technologies • business models • barriers to growth • support needed • consider risk management tools (e.g., credit guarantee facilities) • Publication and presentation of findings to academic and development communities
Deliverables • Week 3. Detailed workplan. • Week 11. A written interim report to IFC that will include: • a general overview of the clean water market in countries surveyed; • analysis of available clean water technologies and delivery models and opportunities to scale them up, • Week 12. Interim report presentation in Washington DC • Week 16. Draft final report • Week 19. Final report submission • Week 20. Dissemination event in DC
Business Models 101 Customers Beachhead customer Distribution channel(s)Marketing strategy Customer service Offering Value proposition: The products & services a business offers. Infrastructure Core capacities to execute Partner network and alliances Value configuration: How a business makes itself mutually beneficial for a itself and its customers. Finances PricingCost structure Revenue model: How company makes money through multiple streams
Key Characteristics of Base of Pyramid (BOP) Market • Labor-Rich • Capital-Poor • Low Education/Low Literacy • Power Dynamics (gender, caste, age, race, etc) • Not One Segment, But Many! • “Dirt-poor” (subsistence-level) • “Climbers” (price-driven, unbranded products) • “Aspirers” (desire brands, can’t purchase consistently) • “Consumers” (brand-driven, purchase consumer durables)
Key Challenges in Marketing to BOP Consumers • Designing safe water solutions that are: • Efficacious • Reliable • Affordable • Durable • Easy to use • Do not require electricity, and, • Appeal to preferences/lifestyles/attitudes of targeted consumer segment(s)
Key Tools for Reaching BOP Consumers Creative Financing Consumer-driven Product Innovation Supply Chain Strengthening Marketing/Behavior Change Community Mobilization Policy changes
Affordability As Barrier to Adoption Affordability is Part Reality and Part Perception… Affordability = Ability + Willingness Household income and cost of technology Understanding, trust, and perceived value placed on product Economic Growth Systemic Shocks Promotional Activities Cost Control Creative Financing Smart Subsidies Hearing/Seeing Satisfied Users Consumer Education Public-Private Partnerships
Leveraging Public-Private Partnerships Public/Donor Sector Roles Private Sector Roles Product Design & Development Quality Assurance Production Distribution Marketing Sales & Financing Supply Chain
Evaluating Business Models:Key Aspects for Strategic Firm Management Opportunity CapitalSources Debt Equity Strategic Business Strategy Value Proposition Marketing Model Ops/Supply Chain Pro Forma Financial Strategy Degrees of Strategic Freedom Time to OOC Risk/Reward FinancialRequirements Driven by: Burn RateCapital InvestmentProfit and LossRevenue Streams Financial Model Business Model