Download
1 / 17
170 likes | 345 Vues
Is Academic Performance Correlated With Per Pupil Spending?. You Decide! Dr. Charles Ormsby Updated May 2007. The $64,000 Question Is Academic Performance Correlated With Per Pupil Spending?.

E N D
Is Academic Performance Correlated With Per Pupil Spending? You Decide! Dr. Charles Ormsby Updated May 2007
The $64,000 QuestionIs Academic Performance Correlated With Per Pupil Spending? • The argument for increasing taxes presupposes that spending more matters and that it will lead to better educational outcomes for our children. Can we assume this? • If there is no correlation between greater spending and better academic results … doesn’t the entire campaign to raise taxes and increase spending fall apart at the seams? • The remaining charts examines the big spender’s core assumption that spending more improves academics • It starts with a quick illustration of what correlated data and uncorrelated data looks like and then examines if spending more will help raise academic outcomes
Correlation • What Does “Correlated” data look like? • A students Math vs. their Verbal SAT Scores • MCAS scores vs. Per Capita Income • What does “Uncorrelated” data look like? • SAT scores vs. Soc Sec numbers • Math performance vs. Country Spending Per Pupil • SAT Scores vs. State Spending Per Pupil • Picking similar towns (no cherry picking) • Finally: Education Spending vs. Academic Outcomes … You decide
SAT Verbal vs. SAT Math Scores CORRELATED DATA SAT Verbal Score SAT Math Score
SAT Score vs. Soc Sec # UNCORRELATED DATA Middle Two Digits of Soc Sec Number
Need More Proof?Let’s Look at State-By-State Data • Do states that spend more have better academic results? • The next chart shows the Combined SAT scores for all states with 49% participation or higher plotted with their per-pupil spending* • What little correlation there is, is negative driven primarily by the District of Columbia. (Without DC, the data is almost exactly uncorrelated.) • Note: The conclusion using all states is unchanged but, since SAT scores can be affected by participation rates and some states (like Utah) • have very low participation rates, only high-participation rate states were included. A cutoff of 49% instead of 50% was used to include • California (the only state below 50% included). As can be seen from the plot, including CA had no effect on the conclusion. SAT data is • from the College Board for 2004 and per-pupil spending is from the NEA for 2004.
WA OR NH MA CT VA CA NJ ME NY RI DE FL GA UNCORRELATED DATA DC
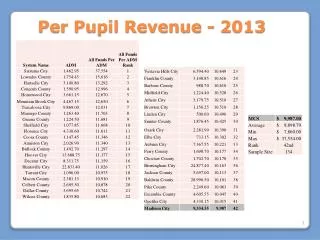
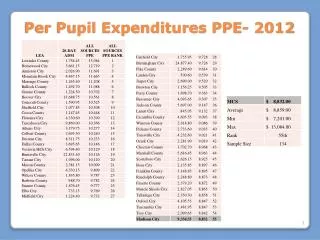
Let’s look at Town Data • First, all Massachusetts communities regardless of size or per capita income • Next, we’ll objectively pick the communities most similar to North Andover based on • Population • Per Capita Income
All MA Communities Plotted DATA IS UNCORRELATED
Picking Towns Similar to North Andover • Combined metric: • * Population • * Per Capita Income • Closest 25 communities chosen
Here It Is – The Answer To the $64,000 QuestionIs Academic Performance Correlated With Increased Per Pupil Spending?And the answer is ….
NO Westford Andover North Andover Burlington Dedham Stoughton Saugus Watertown All data: 2004/05
One Last Plot • We’re told we need to pay teachers more to improve teacher quality and therefore improve academic results • So let’s look at SAT scores vs. average teacher salaries for North Andover and our 25 most similar communities • Surprise, surprise … No correlation!!
Conclusion • Shouldn’t spending advocates start focusing on what matters, and stop trying to raise your taxes in a FUTILE attempt to buy academic achievement? • Until our schools seriously focus on raising standards and expectations, eliminating education fads, encouraging greater parental involvement, controlling spiraling labor costs, and prioritizing our available resources in the classroom (where it matters most), tax increases should not even be considered