Download
1 / 30
300 likes | 889 Vues
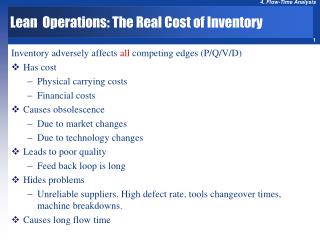
Lean Operations: The Real Cost of Inventory. Inventory adversely affects all competing edges (P/Q/V/D) Has cost Physical carrying costs Financial costs Causes obsolescence Due to market changes Due to technology changes Leads to poor quality Feed back loop is long Hides problems

E N D
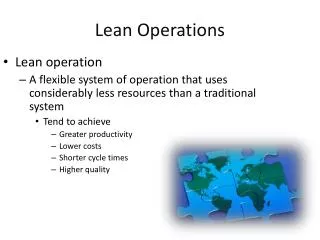
Lean Operations: The Real Cost of Inventory Inventory adversely affects all competing edges (P/Q/V/D) • Has cost • Physical carrying costs • Financial costs • Causes obsolescence • Due to market changes • Due to technology changes • Leads to poor quality • Feed back loop is long • Hides problems • Unreliable suppliers. High defect rate, tools changeover times, machine breakdowns. • Causes long flow time
Flow-Time Analysis Competitive Advantages of a shorter flow time • Shorter response time (both in production and product design) • Delayed differentiation (Postponement) • Lower inventory costs (due to Little’s Law)
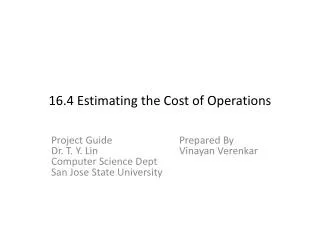
Direct Methods of Measuring Flow Time Direct Method • Observe a process over an extended, specified period of time • Randomly sample flow units over the observation period • Measure the flow time for each flow unit from entry to exit • Compute the average of flow times measured Example • During a given month, a sample of 50 applications was taken • The average flow time = 20.85 working days
Indirect Methods of Measuring Flow Time Indirect Method • Count the number of units produced over an extended period of time • R = number of units produced / duration of time period • Count the number of units of inventory at random points during the time period, and compute the average inventory (I). • Compute T =I/R Example • 200 applications processed during a given month, 20 days of operation during the given month. Throughput for the sample is R=200/20 = 10 applications per day. • After counting the number of applications at 4 random points during the month, the average inventory (I) was 215. • T=I/R T = 215/10 flow time is 21.5 days
Process Flow Chart Process = network of activities performed by resources 1. Flow unit: The unit of analysis– Level of detail 2-3. Network of Activities & Storage/Buffers • Define Process Boundaries • Activities with activity times • Buffers with waiting flow times • Routes:precedence relationships (solid lines) with throughputs 4. Resources & Allocation - Who does what? 5. Information Structure & flow (dashed lines) Key for capacity analysis
Decision Event Physical flow Information flow Flowcharting Activity Buffer • See the total process; a systems view • Define flow units and process boundaries • Include only the key steps • Clarify the level of detail needed. Processes can be broken down into sub-activities. On the other hand, cascading allows several activities to be combined in a single sub-process • Depicts resources required to carry out activities • Identify the processes that need attention (weak points)
Wondershed Inc: Narrative Representation Required activities : • Separate the roof and the base sheets 2. Punch the base 3. Punch the roof 4. Form the base 4. Form the roof 6. Sub-assemble the base 7.Assemble 8.Inspect
Activity A Activity B Activity C End Start Wondershed Inc. : Schematic Representation Punch base Form base Sub assemble base Separate Sheet Start Punch roof Form roof End Assemble Inspect
Theoretical Flow Time Buffer Theoretical Flow Time: The minimum amount of time required for processing a typical flow unit without any waiting Activity Entry Exit Activity Time: The time required by a typical flow unit to complete the activity once. Unless stated otherwise, we assume that an activity can not be broken down into smaller activities that can be executed in parallel. What does that mean???
Activity Time 1 Activity Time 2 Activity Time 3 Activity Time 1 Activity Time 2 Activity Time 3 Activity Time 1 Activity Time 4 Activity Time 5 Activity Time 2 Activity Time 3 Activity Time 6 Sequential Activities Sequential Activities Parallel Activities Critical Path Theoretical flow time of each path in the process flowchart = sum of the activity times of all activities on that path Critical Path: the longest path Critical Activities: activities that lie on the critical path The theoretical flow time of the process = the time of the theoretical critical path How many Paths?
Wondershed Inc. Theoretical Flow Time Path 1 (roof) Start 1 3 5 7 8 End = 80 minutes Path 2 (base) Start 1 2 4 6 78 End = 90 minutes
Average Wait Time, Average Flow Time Average waiting time for roof T = I / R = 80 / 16.5 = 4.85 hours or 291 minutes Average waiting time for base T = I / R = 90 / 16.5 = 5.45 hours or 327 minutes Theoretical flow times Roof 80 minutes Base 90 minutes Flow Times Roof 291 + 80 = 371 minutes Base 327 + 90 = 417 minutes 16.5 sheds average flow rate (R) per hour based on empirical data
Value-adding vs. Non-value-adding activities Value-adding activities are those activities that increase the value of a flow units • Example: assembly, surgery, piloting an airplane, etc. Non value adding activities are activities that do not directly increase the value of a flow unit. • Re-work • Transport • Inspection • Waiting Flow time = Value-adding times + Non-value-adding times
Activity Time, Number of Visits and Work Content Activity time is time required by a typical flow unit to complete the activity once. Sometimes we may need to repeat an activity, i.e. the number of visits is not necessarily 1. Work content = Activity time × Average number of visits Theoretical flow time is computed based on work content not based on Activity time
Theoretical Flow Time vs. Flow Time Theoretical flow time = 90 Flow time = 432 Flow Time Efficiency = Theoretical Flow Time / Flow Time Flow Time Efficiency = 105/432 = 24%
Reducing Theoretical Flow Time: Shorten the Length of Every Critical Path by 3 Basic Approaches • Eliminate: Reducing the work content of critical activities • Work smarter: Eliminate non-value-adding aspects of the activity: • Work Faster: Increase the speed at which the activity is performed, e.g. Better Methods, Training, Advanced Technology, Better Management. • Work right in the first time: Reduce repetitions of the activity • Work in parallel: Moving work off the critical path • Move work off the critical path to a noncritical activity • Move work off the critical path to the outer loop (pre- or post-processing) • Select: Modify the product mix • Make more of a product that requires less processing time reduce overall flow time (Given market condition)
Levers for Managing Theoretical Flow Time - Move work to the outer loop (pre-meeting “homework”) - Work in parallel (professionals work simultaneously) - Elimination of non-value-adding work(only two meetings)
6 4 A3 A1 4 3 E S A4 A6 3 2 A2 A5 Critical Path Method: The Network Find the Critical Path.
A3 A1 S E A4 A6 A2 A5 Critical Path Method: Paths How many path? 6 4 4 3 3 2 10 11 8 Critical Path is the longest Path
6 4 A3 A1 0 0 4 3 0 S E A4 A6 0 3 2 0 A2 A5 0 Forward Path; Earliest Starts 4 4 10 10 11 11 4 4 4 10 11 8 8 4 5 11 4 8 8 5 3 3 3 3 5
Forward Path Max = 30 35 10 35 35 30 20 5
6 4 4 A3 4 A1 10 10 11 11 4 0 0 4 4 10 4 3 0 S E A4 A6 8 8 4 0 5 11 4 8 8 3 2 0 A2 A5 5 3 3 0 3 3 5 Backward Path; Latest Starts 5 11 0 4 5 5 11 11 11 4 0 11 4 8 8 11 11 0 4 8 8 11 8 3 3 3 6 6 8 8 6 6
30 30 30 Backward Path Min = 35 30 35 45 5
Activity Slack • Slack, or float: The amount of time a noncritical task can be delayed without delaying the project • Slack—LFT – EFT or LST – EST • EST—Earliest Start Time; Largest EFT of all predecessors • EFT—Earliest Finish Time; EST + duration for this task • LFT—Latest Finish Time; Smallest LST of following tasks • LST—Latest Start Time; LFT – duration for this task 3/10/2014 ArdavanAsef-Vaziri 5-1-26
A3 A1 E S A4 A6 A2 A5 Critical Path, Slacks 6 4 5 11 0 4 11 11 0 4 4 10 4 8 4 8 11 3 11 4 8 8 3 3 6 6 2 8 3 0 3 5
W6 W1 W3 W2 W7 W4 W9 W8 W5 E S Theoretical Critical Path vs. Critical Path The time of the critical path differs from the time of the theoretical critical path. Why? 6 4 A3 A1 4 3 A4 A6 3 2 A2 A5 The critical path itself also may differ from the theoretical critical path. Why?
Practice: Draw the Network of Activities Task Pred. Dur.Task Pred. Dur. a -- 4 g c,d 1 b -- 3 h e 4 c a 3 i f 5 d a 2 j e,g 6 e b 6 k h,i 1 f b 4 For each task, compute ES, EF, LF, LS, slack 3/10/2014 ArdavanAsef-Vaziri 5-1-29
Practice: Compute the Theoretical Flow Time LST LFT c=3 slack= Task=dur slack=xxx EST EFT g=1 slack= a=4 slack= j=6 slack= d=2 slack= Finish Start e=6 slack= h=4 slack= b=3 slack= k=1 slack= f=4 slack= i=5 slack= 3/10/2014 ArdavanAsef-Vaziri 5-1-30