PROJECT UPDATE: Performance Measures for U. S. Wildlife Conservation Activities
370 likes | 711 Vues
PROJECT UPDATE: Performance Measures for U. S. Wildlife Conservation Activities Jonathan Mawdsley Robin O’Malley The Heinz Center Questions Project Is Addressing What are the steps for developing performance measures for wildlife conservation activities?

PROJECT UPDATE: Performance Measures for U. S. Wildlife Conservation Activities
E N D
Presentation Transcript
PROJECT UPDATE: Performance Measures for U. S. Wildlife Conservation Activities Jonathan Mawdsley Robin O’Malley The Heinz Center
Questions Project Is Addressing • What are the steps for developing performance measures for wildlife conservation activities? • What are some sample measures that might be used at the state level to: • Measure and evaluate individual implementation projects • Report on “how wildlife are doing” in the state
Where we are now: • 2 meetings of project working group • Clear consensus from literature, working group on steps to be followed in developing performance measures • Sample metrics for lots of different types of activities (including non-biological responses) • Suggestions for a few large-scale, state-wide metrics • Developing report, other materials TBD • Interest in testing approach with individual states
Project Working Group • State agency staff from: • Vermont (Jon Kart) • Florida (Tim O’Meara) • Nebraska (Mark Humpert) • Oregon (Audrey Hatch) • Non-profits: AFWA, NFWF, NWF, NCASI, etc. • Federal agencies: FWS, BLM, FS, USGS • Business: International Paper • Academia: Dennis Murphy, Barry Noon Plus a number of informal advisors
A Conversation with Wildlife Diversity Managers Some topics: • Importance of Measuring – And Reporting! • Coarse Filter Metrics • Fine Filter Metrics • Opportunity for Regional Brainstorming • Steps for Selecting Performance Indicators (for specific implementation projects)
Importance of Measuring • Congress, OMB, U. S. FWS want results • Interest in longer-term, big-picture outcomes, more so than short-term outputs • Program evaluation now being done on the basis of a very few (1-5) measures • We are in a fortunate position to be able to suggest possible indicators!
Sample Metrics:Start with a Coarse Filter Approach • Committee emphasized the importance of a coarse filter approach, given the extreme resource limitations facing states • Coarse filter asks how are ecosystems, major habitat units doing? By inference, how are species within those units doing? • Committee reviewed two types of coarse filter measures: ecosystem extent and landscape pattern
Questions Addressed byExtent Measures • How much of the (ecosystem type, veg. cover class, habitat type, landscape of interest, focal area…) do we have? • What are the trends in extent (are we losing ground)? • How much have we protected? • How much do we have in some form of conservation management? • How much of this area have we done other conservation work on (restoration, etc.)
Extent Measures • Area of (ecosystem, veg. cover class, landscape…) of interest. Can measure quantitatively using GIS, satellite imagery. • Trends in area (increasing, stable, decreasing) • Amount of this area protected • Amount of this area that is in some form of conservation management
Questions Addressed by Landscape Pattern Measures • How is the (ecosystem, veg. cover class, habitat type…) of interest distributed across the broader landscape? • How fragmented is the (ecosystem, veg. cover class, habitat type…) of interest? • What are the surroundings of a particular natural area / park / conservation interest area?
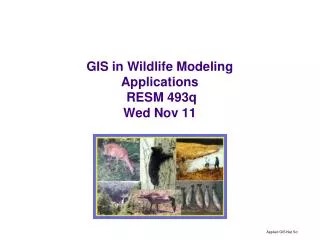
Landscape Pattern Measure • Heinz Center has developed GIS-based approach using National Land Cover Dataset (30 m resolution) • Looks at surroundings of each pixel representing a “natural” vegetation type, and determines whether surroundings are also “natural,” or anthropogenic. • Also determines size of “natural” patches
Landscape Pattern Measure • Scale-independent: can be applied to any data set with pixels • Can be applied to a variety of scenarios: • Surroundings of a particular natural area • Surroundings of a particular veg. cover type
Sample Metrics – Fine Filter • Strong public & political interest in the question of “how species are doing” • Simply not feasible to measure, report on every species • Two approaches: • In-depth study of a few select species • Summary statistics for a larger group of species (e.g. migratory birds, butterflies, listed species, top priority SGCN)
Fine Filter Measures – Single Species • Select a small group of species and report on each one individually • Very hard to do well or with sufficient precision to make definitive statements about population status and trends • Demographic parameters may be more important than counts of individuals • May be feasible for a few species in each state (some game species, ESA-listed species)
Fine Filter Measures – Multiple Species • Report trends across a larger group of species • Not feasible to do for all SGCN • Committee felt it might be helpful to know percentage of your focal species for which populations were either increasing, stable, declining, or don’t know • Looked at many possible multi-species indices, didn’t like any of them • “Pie chart” allows you to combine non-quantitative and quantitative assessments in a single graphic
Regional Break-out • What are priority species across some/all states in your region? • What are priority habitat types across some/all states in your region? • Other monitoring issues that may be more appropriate at a regional level? • Does a regional approach make sense? If so, what would next steps be?
General Approach for Selecting Performance MeasuresFor Implementation Projects Consensus from literature, project working group
Steps in the Development of Performance Measures • Define the goals and objectives of management • Identify key resources/processes for stewardship • Identify threats to these resources/processes • Identify actions to address management needs • Develop conceptual models linking stressors to resource states/process rates • Select indicators of resource state/process rates • Develop protocols for indicator measurement • Implement project, including monitoring • Link monitoring results to decision-making
Simple Conceptual Models: Causal chains / Results Chains / Logic Frameworks
Why Models? • Ground a project in current / best available science • Explicitly state your assumptions regarding cause-and-effect relationships (theory of change) in a project/program • Expedite story-telling and reporting • If theory wrong, project likely to fail • If theory right, project can still fail (implementation failure)
Prescribed fire and mechanical control of woody vegetation CONSERVATION ACTIVITIES Reduction in woody vegetation cover Increase in nesting, foraging habitat for grassland birds INTERMEDIATE OUTCOMES Increase in grassland bird reproduction, survivorship Grassland bird populations increase ULTIMATE OUTCOME Prescribed fire and mechanical control of woody vegetation CONSERVATION ACTIVITIES Reduction in woody vegetation cover Increase in nesting, foraging habitat for grassland birds INTERMEDIATE OUTCOMES Increase in grassland bird reproduction, survivorship Grassland bird populations increase ULTIMATE OUTCOME
Measure with Surveyor’s Equipment Prescribed fire and mechanical control of woody vegetation Area Treated Percent Woody Cover Reduction in woody vegetation cover Measure Digitized Aerial Photos Increase in nesting, foraging habitat for grassland birds Percent Open Grassland Increase in grassland bird reproduction, survivorship Nesting pairs of target species Local Bird Club Conducts Surveys Population of target species Grassland bird populations increase
What happens if you can’t measure ultimate outcome(s) directly? • Time lag between activity and outcome • Prohibitively expensive • Monitoring system not in place • Existing monitoring system not at right spatial scale, time interval, etc. • Don’t have good protocols or approaches for monitoring a particular species or group of interest
Measure with Surveyor’s Equipment Prescribed fire and mechanical control of woody vegetation Area Treated Percent Woody Cover Reduction in woody vegetation cover Measure Digitized Aerial Photos Increase in nesting, foraging habitat for grassland birds Percent Open Grassland Increase in grassland bird reproduction, survivorship Nesting pairs of target species PROXY INDICATOR ?? Population of target species Grassland bird populations increase
Non-Biological Responses We recognize that many implementation activities will not necessarily show an immediate biological response: • Coalition development • Outreach • Education and training • Fundraising • Further planning
How to Measure Non-Biological Responses? Typical short-term outputs: • Number of members of Teaming coalition • Dollars raised / leveraged • Number of people who see your presentation • Number of people who attend trainings or workshops • Plans written / documents produced
How to Measure Non-Biological Responses? More informative short-term measures: • Number of acres managed for wildlife by your partners • Number of citizens represented by organizations in your coalition • How many of your new partners do on-the-ground habitat management? land protection work? Etc. • Other opportunities for leveraging from new partners ($, resources, expertise)?
Logic Models Can Help Here, Too! • Explain how you think these other implementation activities will lead to longer-term biological outcomes (wildlife & habitat) (Helps explain why are you doing these other activities) • Use logic models to show the steps leading from these other implementation activities to wildlife & habitat outcomes
Logic Model of Garden Club Visit Give Presentation To Garden Club Garden Club Members Identify SWAP-Compatible Activities Garden Club Members Build, Install Bluebird Nest Boxes Increased Nesting Habitat for Bluebirds Increased Bluebird Populations
Group Exercise • If you could only measure and report on one thing in your state related to the status or condition of wildlife (answering the question “how are wildlife doing?”), what would it be? • Is it currently feasible for you to measure this? Could it be measured by one or more of the partners in your Teaming coalition?
Linking Targets and Threats A target is a species, habitat or ecosystem type or feature that is the subject of a conservation program TARGET FACTORS are aspects of the environment or human behavior that affect the target. Factors that affect the target negatively are known as THREATS. DIRECT FACTOR CONTRIBUTING FACTOR
A simplified example… GRASSLAND BIRDS Loss of Habitat Predation from feral cats Woody encroachment Suburban Development
Identify Factors You Can Affect • What factors are most likely to cause harm to target (long term vs. short term)? • What factors can we do something about (knowledge, expertise, access, political power / will)? • Where can we best apply existing resources (knowledge, expertise, access, funding)? • Where could we apply additional resources if they become available?
GOAL General statement of the desired condition for the target Visionary, relatively general, brief, measurable OBJECTIVES Specific statement detailing desired accomplishments or outcomes of the project Impact oriented, measurable, time limited, specific, and practical For Targets, Identify Goals; For Factors, Identify Objectives
Basic Structure and Key Elements of a Logic Framework or Causal Chain (a.k.a. Results Chain) GOAL OBJECTIVES ACTIVITIES One-to many relationships (Goal may lead to multiple Objectives, etc.) OUTPUTS OUTCOMES