Download
1 / 38
391 likes | 618 Vues
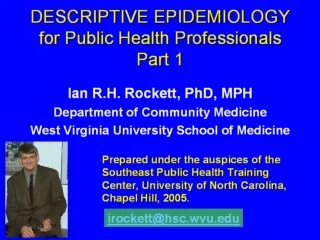
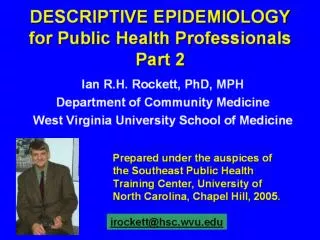
DESCRIPTIVE EPIDEMIOLOGY for Public Health Professionals Part 2. Ian R.H. Rockett, PhD, MPH Department of Community Medicine West Virginia University School of Medicine. Prepared under the auspices of the Southeast Public Health Training Center, University of North Carolina, Chapel Hill, 2005.

E N D
DESCRIPTIVE EPIDEMIOLOGYfor Public Health Professionals Part 2 Ian R.H. Rockett, PhD, MPH Department of Community Medicine West Virginia University School of Medicine Prepared under the auspices of the Southeast Public Health Training Center, University of North Carolina, Chapel Hill, 2005. irockett@hsc.wvu.edu
DISEASE and INJURY MODELS
The Epidemiologic Triad HOST AGENT ENVIRONMENT
Factors involved in the Natural History of Disease Agent Vector Environment Host
Levels of Prevention • Primary • Secondary • Tertiary
Source: Ian R.H. Rockett. Injury and Violence: A Public Health Perspective. Population Bulletin 53(4); 1998: 18. Adapted from G.S Smith and H. Falk, Unintentional Injuries. American Journal of Preventive Medicine 3(5) Supplement; 1997:143-163.
The Wheel of Causation Social Environment Biological Environment Host (human) Genetic Core Physical Environment
Web of Causation-- de-emphasizes the disease agent and allows for multifactorial causes
Web of Causation applied to Myocardial Infarction Source: Ian R.H. Rockett. Population and Health: An Introduction to Epidemiology. Population Bulletin 54(4); 1999: 18. Adapted from R.A. Stallones, Public Health Monograph 76;1966:53.
Wider Application of the Web • Epidemiologic Triad (devised to enhance search for understanding communicable disease) • Web of Causation (devised to address chronic disease – can also be applied to communicable disease)
DATA SOURCES and DEVELOPMENT of INFORMATION
Natural History of Disease/Injury and Related Data Sources HEALTH OUTCOMESCure Control Disability Death Good Health Disease Onset Care Seeking Symptoms Diagnosis Therapy Screening Test Results Interviews SELECTED DATA SOURCES Medical Records Hospital/ED Records Death Certificates Medical Examiner aaaaRecords
Source: Leon Gordis, Epidemiology, 2d edition; Philadelphia, PA: Saunders, 2000: 50.
Uncertainty in Reported Cause of Death MichaelAlderson (1988) identified four areas where uncertainties or inaccuracies can arise in reporting causes of death: • incorrect diagnosis (last attending physician and/or autopsy) • incorrect completion of death certificate • inaccurate processing and publication of the mortality statistics • invalid classification of diseases/injuries
Use of Medical Examiner and Coroner Records to supplement Death Certificate Data Need to rule out homicide, suicide or “accident” , i.e., unintentional injury, before a death can be validly attributed to natural causes. Homicide or SIDS?
Disease and Injury Mortality are only the Tip of the Iceberg
General Sources of Morbidity Data 1. Disease reporting -- communicable diseases, cancer registries 2. Data accumulated as a by-product of insurance and prepaid medical care plans a. Group health and accident insurance b. Prepaid medical care plans c. State disability insurance plans d. Life insurance companies e. Hospital insurance plans f. Railroad Retirement Board 3. Tax-financed public assistance and medical care plans a. Public assistance, aid to the blind, aid to the disabled b. State or federal medical care plans c. Armed Forces d. Veterans Administration
General Sources of Morbidity Data continued. . . 4. Hospitals and clinics 5. Absenteeism records -- industry and schools 6. Pre-employment and periodic physical examinations in industry and schools 7. Case-finding programs 8. Selective service records 9. Morbidity surveys on population samples (e.g., National Health Survey, National Cancer Surveys) Source: Leon Gordis. Epidemiology. Third edition. Philadelphia, PA, 2004: 37.
ICD and ICD-CM • The International Statistical Classification of Diseases and Related Health Problems (ICD) can be used for coding and classifying mortality data from death certificates • The International Classification of Diseases Clinical Modification (ICD-CM) can be used to code and classify disease and injury morbidity data from inpatient and outpatient records
Dynamic Classification Causes of disease, injury and disability may wax and wane. ICD needs to be flexible, especially in responding to new circumstances: e.g. SARS, terrorism attributable health outcomes as from such varied causes as asphyxiation, chemical burns, falls and jumping from buildings, and suicide and suicide attempts
Primary data are new data collected by or for the investigator Secondary data refer to existing data
Stages of Development of Information • Public health surveillance – development and refinement of data systems for the ongoing and systematic collection, analysis, interpretation and dissemination of information
Stages of Development of Information • Risk group identification – identification of persons at greatest risk of disease or injury and the places, times, and other circumstances that are associated with elevated risks
Stages of Development of Information • Risk factor identification – analytic exploration of potentially causative risk factors for disease, injury or death as suggested by the high risk population and other research
Stages of Development of Information • Program development, implementation, and evaluation – design, implementation and evaluation of preventive interventions based on degree of understanding of the population-at-risk and the risk factors for the outcome of interest
The government is very keen on amassing statistics. They collect them, add them, raise them to the nth power, take the cube root and prepare wonderful diagrams. But you must never forget that every one of these figures comes in the first instance from the village watchman, who just puts down what he damn well pleases. Sir Josiah Stamp, British Economist (1880-1941)