Descriptive Epidemiology
Descriptive Epidemiology. Bioterrorism Epidemiology Module 5 Missouri Department of Health And Senior Services. Descriptive Epidemiology. Descriptive Epidemiology. Person. Descriptive Epidemiology. Person Place. Descriptive Epidemiology. Person Place Time. Demographic Age Gender

Descriptive Epidemiology
E N D
Presentation Transcript
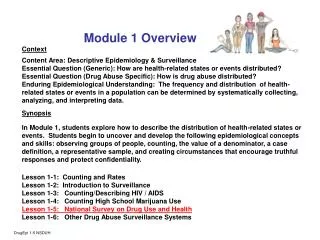
Descriptive Epidemiology Bioterrorism Epidemiology Module 5 Missouri Department of Health And Senior Services
Descriptive Epidemiology • Person
Descriptive Epidemiology • Person • Place
Descriptive Epidemiology • Person • Place • Time
Demographic Age Gender Race Ethnic group Income Education Occupation Marital status Personality type Religion Person
Person • Family variables • Family size • Maternal age • Mother’s education • Birth order • Parental deprivation
Other variables Blood type Past environmental exposures Personality traits Immune status Vaccination status Nutritional status Exercise routine Person
Place • School • Residence • Workplace • Restaurants • Convention or recreational sites • Recent travel history
Time • Secular trends • Cyclic changes • Clusters in time and place
Histogram Data from Sverdlovsk in former Soviet Union
Line Graph Data from Sverdlovsk in former Soviet Union
Line Graph Data from Sverdlovsk in former Soviet Union
Line Graph Data from Sverdlovsk in former Soviet Union
Line Graph Data from Sverdlovsk in former Soviet Union
Line Graph Data from Sverdlovsk in former Soviet Union
Bar Charts Data from Sverdlovsk in former Soviet Union
Bar Charts Data from Sverdlovsk in former Soviet Union
Bar Charts Data from Sverdlovsk in former Soviet Union
Bar Charts Data from Sverdlovsk in former Soviet Union
Bar Charts Data from Sverdlovsk in former Soviet Union
Bar Charts Data from Sverdlovsk in former Soviet Union
Bar Charts Data from Sverdlovsk in former Soviet Union
Bar Charts Data from Sverdlovsk in former Soviet Union
Pie Chart Data from Sverdlovsk in former Soviet Union
Pie Chart Data from Sverdlovsk in former Soviet Union
Pie Chart Data from Sverdlovsk in former Soviet Union 12% 82%
Boxplots Data from Sverdlovsk in former Soviet Union
Boxplots Data from Sverdlovsk in former Soviet Union
Boxplots Data from Sverdlovsk in former Soviet Union
Boxplots Data from Sverdlovsk in former Soviet Union
Boxplots Data from Sverdlovsk in former Soviet Union
Scatter Plot Data from Sverdlovsk in former Soviet Union
Scatter Plot Data from Sverdlovsk in former Soviet Union
Scatter Plot Data from Sverdlovsk in former Soviet Union
Scatter Plot Data from Sverdlovsk in former Soviet Union