Microstructure-Properties: II Fatigue
Microstructure-Properties: II Fatigue. 27-302 Lecture 9 Fall, 2002 Prof. A. D. Rollett. Materials Tetrahedron. Processing. Performance. Properties. Microstructure. Objective.

Microstructure-Properties: II Fatigue
E N D
Presentation Transcript
Microstructure-Properties: IIFatigue 27-302 Lecture 9 Fall, 2002 Prof. A. D. Rollett
Materials Tetrahedron Processing Performance Properties Microstructure
Objective • The objective of this lecture is to explain the phenomenon of fatigue and also to show how resistance to fatigue failure depends on microstructure. • For 27-302, Fall 2002: this slide set contains more material than can be covered in the time available. Slides that contain material over and above that expected for this course are marked “*”.
References • Mechanical Behavior of Materials (2000), T. H. Courtney, McGraw-Hill, Boston. • Phase transformations in metals and alloys, D.A. Porter, & K.E. Easterling, Chapman & Hall. • Materials Principles & Practice, Butterworth Heinemann, Edited by C. Newey & G. Weaver. • Mechanical Metallurgy, McGrawHill, G.E. Dieter, 3rd Ed. • Light Alloys (1996), I.J. Polmear, Wiley, 3rd Ed. • Hull, D. and D. J. Bacon (1984). Introduction to Dislocations. Oxford, UK, Pergamon.
Notation sa := Alternating stresssm := Mean stressR := Stress ratioe := strainNf := number of cycles to failureA := Amplitude ratio∆pl := Plastic strain amplitude∆el := Elastic strain amplitudeK’ := Proportionality constant, cyclic stress-strainn’ := Exponent in cyclic stress-strainc := Exponent in Coffin-Manson Eq.; also, crack lengthE:= Young’s modulusb := exponent in Basquin Eq.m := exponent in Paris LawK := Stress intensity ∆K := Stress intensity amplitude a := crack length
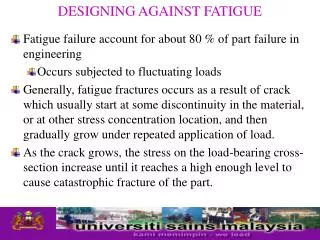
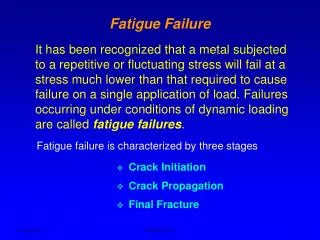
Fatigue • Fatigue is the name given to failure in response to alternating loads (as opposed to monotonic straining). • Instead of measuring the resistance to fatigue failure through an upper limit to strain (as in ductility), the typical measure of fatigue resistance is expressed in terms of numbers of cycles to failure. For a given number of cycles (required in an application), sometimes the stress (that can be safely endured by the material) is specified.
Fatigue: general characteristics • Primary design criterion in rotating parts. • Fatigue as a name for the phenomenon based on the notion of a material becoming “tired”, i.e. failing at less than its nominal strength. • Cyclical strain (stress) leads to fatigue failure. • Occurs in metals and polymers but rarely in ceramics. • Also an issue for “static” parts, e.g. bridges. • Cyclic loading stress limit<static stress capability.
Fatigue: general characteristics • Most applications of structural materials involve cyclic loading; any net tensile stress leads to fatigue. • Fatigue failure surfaces have three characteristic features: [see next slide, also Courtney figs. 12.1, 12.2] • A (near-)surface defect as the origin of the crack • Striations corresponding to slow, intermittent crack growth • Dull, fibrous brittle fracture surface (rapid growth). • Life of structural components generally limited by cyclic loading, not static strength. • Most environmental factors shorten life.
S-N Curves • S-N [stress-number of cycles to failure] curve defines locus of cycles-to-failure for given cyclic stress. • Rotating-beam fatigue test is standard; also alternating tension-compression. • Plot stress versus the log(number of cycles to failure), log(Nf). [see next slide, also Courtney figs. 12.8, 12.9] • For frequencies < 200Hz, metals are insensitive to frequency; fatigue life in polymers is frequency dependent. [Hertzberg]
Fatigue testing, S-N curve smean 3 > smean 2 > smean 1 The greater the number ofcycles in the loading history,the smaller the stress thatthe material can withstandwithout failure. sa smean 1 smean 2 smean 3 log Nf Note the presence of afatigue limit in manysteels and its absencein aluminum alloys. [Dieter]
Endurance Limits • Some materials exhibit endurance limits, i.e. a stress below which the life is infinite: [fig. 12.8] • Steels typically show an endurance limit, = 40% of yield; this is typically associated with the presence of a solute (carbon, nitrogen) that pines dislocations and prevents dislocation motion at small displacements or strains (which is apparent in an upper yield point). • Aluminum alloys do not show endurance limits; this is related to the absence of dislocation-pinning solutes. • At large Nf, the lifetime is dominated by nucleation. • Therefore strengthening the surface (shot peening) is beneficial to delay crack nucleation and extend life.
Fatigue fracture surface [Hertzberg]
Fatigue crack stages Stage 1 [Dieter] Stage 2
Fatigue Crack Propagation • Crack Nucleation stress intensification at crack tip. • Stress intensity crack propagation (growth);- stage I growth on shear planes (45°),strong influence of microstructure[Courtney: fig.12.3a]- stage II growth normal to tensile load (90°)weak influence of microstructure[Courtney: fig.12.3b]. • Crack propagation catastrophic, or ductile failure at crack length dependent on boundary conditions, fracture toughness.
Fatigue Crack Nucleation • Flaws, cracks, voids can all act as crack nucleation sites, especially at the surface. • Therefore, smooth surfaces increase the time to nucleation; notches, stress risers decrease fatigue life. • Dislocation activity (slip) can also nucleate fatigue cracks.
Dislocation Slip Crack Nucleation • Dislocation slip -> tendency to localize slip in bands. [see slide 10, also Courtney fig. 12.3] • Persistent Slip Bands (PSB’s) characteristic of cyclic strains. • Slip Bands -> extrusion at free surface. [see next slide for fig. from Murakami et al.] • Extrusions -> intrusions and crack nucleation.
Design Philosophy: Damage Tolerant Design • S-N (stress-cycles) curves = basic characterization. • Old Design Philosophy = Infinite Life design: accept empirical information about fatigue life (S-N curves); apply a (large!) safety factor; retire components or assemblies at the pre-set life limit, e.g. Nf=107. • *Crack Growth Rate characterization -> • *Modern Design Philosophy (Air Force, not Navy carriers!) = Damage Tolerant design: accept presence of cracks in components. Determine life based on prediction of crack growth rate.
Definitions: Stress Ratios • Alternating Stress • Mean stress m = (max +min)/2. • Pure sine wave Mean stress=0. • Stress ratio R = max/min. • For m = 0, R=-1 • Amplitude ratio A = (1-R)/(1+R). • Statistical approach shows significant distribution in Nf for given stress. • See Courtney fig. 12.6; also following slide.
Alternating Stress Diagrams [Dieter]
Mean Stress • Alternating stress a = (max-min)/2. • Raising the mean stress (m) decreases Nf. [see slide 19, also Courtney fig. 12.9] • Various relations between R = 0 limit and the ultimate (or yield) stress are known as Soderberg (linear to yield stress), Goodman (linear to ultimate) and Gerber (parabolic to ultimate). [Courtney, fig. 12.10, problem 12.3] endurance limit at zero mean stress sa tensile strength smean
Cyclic strain vs. cyclic stress • Cyclic strain control complements cyclic stress characterization: applicable to thermal fatigue, or fixed displacement conditions. • Cyclic stress-strain testing defined by a controlled strain range, ∆pl. [see next slide, Courtney, figs. 12.24,12.25] • Soft, annealed metals tend to harden; strengthened metals tend to soften. • Thus, many materials tend towards a fixed cycle, i.e. constant stress, strain amplitudes.
Cyclic stress-strain curve [Courtney] • Large number of cycles typically needed to reach asymptotic hysteresis loop (~100). • Softening or hardening possible. [fig. 12.26]
Cyclic stress-strain [Courtney] • Wavy-slip materials generally reach asymptote in cyclic stress-strain: planar slip materials (e.g. brass) exhibit history dependence. • Cyclic stress-strain curve defined by the extrema, i.e. the “tips” of the hysteresis loops. [Courtney fig. 12.27] • Cyclic stress-strain curves tend to lie below those for monotonic tensile tests. • Polymers tend to soften in cyclic straining.
Cyclic Strain Control • Strain is a more logical independent variable for characterization of fatigue. [fig. 12.11] • Define an elastic strain range as ∆eel = ∆s/E. • Define a plastic strain range, ∆epl. • Typically observe a change in slope between the elastic and plastic regimes. [fig. 12.12] • Low cycle fatigue (small Nf) dominated by plastic strain: high cycle fatigue (large Nf) dominated by elastic strain.
Strain control of fatigue [Courtney]
Cyclic Strain control: low cycle • Constitutive relation for cyclic stress-strain: • n’ ≈ 0.1-0.2 • Fatigue life: Coffin Manson relation: • f~ true fracture strain; close to tensile ductility • c ≈ -0.5 to -0.7 • c = -1/(1+5n’); large n’ longer life.
Cyclic Strain control: high cycle • For elastic-dominated strains at high cycles, adapt Basquin’s equation: • Intercept on strain axis of extrapolated elastic line = sf/E. • High cycle = elastic strain control: slope (in elastic regime) = b = -n’/(1+5n’)[Courtney, fig. 12.13] • The high cycle fatigue strength, sf, scales with the yield stress high strength good in high-cycle
Strain amplitude - cycles [Courtney]
Total strain (plastic+elastic) life • Low cycle = plastic control: slope = c • Add the elastic and plastic strains. • Cross-over between elastic and plastic control is typically at Nf = 103 cycles. • Ductility useful for low-cycle; strength for high cycle • Examples of Maraging steel for high cycle endurance, annealed 4340 for low cycle fatigue strength.
Fatigue Crack Propagation • Crack Length := a.Number of cycles := NCrack Growth Rate := da/dNAmplitude of Stress Intensity := ∆K = ∆s√c. • Define three stages of crack growth, I, II and III, in a plot of da/dN versus ∆K. • Stage II crack growth: application of linear elastic fracture mechanics. • Can consider the crack growth rate to be related to the applied stress intensity. • Crack growth rate somewhat insensitive to R (if R<0) in Stage II [fig. 12.16, 12.18b] • Environmental effects can be dramatic, e.g. H in Fe, in increasing crack growth rates.
Fatigue Crack Propagation da/dN • Three stages of crack growth, I, II and III. • Stage I: transition to a finite crack growth rate from no propagation below a threshold value of ∆K. • Stage II: “power law” dependence of crack growth rate on ∆K. • Stage III: acceleration of growth rate with ∆K, approaching catastrophic fracture. I II ∆Kc III ∆K ∆Kth
*Paris Law • Paris Law: • m ~ 3 (steel); m ~ 4 (aluminum). • Crack nucleation ignored! • Threshold ~ Stage I • The threshold represents an endurance limit. • For ceramics, threshold is close to KIC. • Crack growth rate increases with R (for R>0). [fig. 12.18a]
*Striations- mechanism • Striations occur by development of slip bands in each cycle, followed by tip blunting, followed by closure. • Can integrate the growth rate to obtain cycles as related to cyclic stress-strain behavior. [Eqs. 12.6-12.8]
*Striations, contd. • Provided that m>2 and a is constant, can integrate. • If the initial crack length is much less than the final length, c0<cf, then approximate thus: • Can use this to predict fatigue life based on known crack
*Damage Tolerant Design • Calculate expected growth rates from dc/dN data. • Perform NDE on all flight-critical components. • If crack is found, calculate the expected life of the component. • Replace, rebuild if too close to life limit. • Endurance limits.
Geometrical effects • Notches decrease fatigue life through stress concentration. • Increasing specimen size lowers fatigue life. • Surface roughness lowers life, again through stress concentration. • Moderate compressive stress at the surface increases life (shot peening); it is harder to nucleate a crack when the local stress state opposes crack opening. • Corrosive environment lowers life; corrosion either increases the rate at which material is removed from the crack tip and/or it produces material on the crack surfaces that forces the crack open (e.g. oxidation). • Failure mechanisms
Microstructure-Fatigue Relationships • What are the important issues in microstructure-fatigue relationships? • Answer: three major factors. 1: geometry of the specimen (previous slide); anything on the surface that is a site of stress concentration will promote crack formation (shorten the time required for nucleation of cracks). 2: defects in the material; anything inside the material that can reduce the stress and/or strain required to nucleate a crack (shorten the time required for nucleation of cracks). 3: dislocation slip characteristics; if dislocation glide is confined to particular slip planes (called planar slip) then dislocations can pile up at any grain boundary or phase boundary. The head of the pile-up is a stress concentration which can initiate a crack.
Microstructure affects Crack Nucleation da/dN • The main effect of microstructure (defects, surface treatment, etc.) is almost all in the low stress intensity regime, i.e. Stage I. Defects, for example, make it easier to nucleate a crack, which translates into a lower threshold for crack propagation (∆Kth). • Microstructure also affects fracture toughness and therefore Stage III. I II ∆Kc III ∆K ∆Kth
Defects in Materials • Descriptions of defects in materials at the sophomore level focuses, appropriately on intrinsic defects (vacancies, dislocations). For the materials engineer, however, defects include extrinsic defects such as voids, inclusions, grain boundary films, and other types of undesirable second phases. • Voids are introduced either by gas evolution in solidification or by incomplete sintering in powder consolidation. • Inclusions are second phases entrained in a material during solidification. In metals, inclusions are generally oxides from the surface of the metal melt, or a slag. • Grain boundary films are common in ceramics as glassy films from impurities. • In aluminum alloys, there is a hierachy of names for second phase particles; inclusions are unwanted oxides (e.g. Al2O3); dispersoids are intermetallic particles that, once precipitated, are thermodynamically stable (e.g. AlFeSi compounds); precipitates are intermetallic particles that can be dissolved or precipiated depending on temperature (e.g. AlCu compounds).
Metallurgical Control: fine particles • Tendency to localization of flow is deleterious to the initiation of fatigue cracks, e.g. Al-7050 with non-shearable vs. shearable precipitates (Stage I in a da/dN plot). Also Al-Cu-Mg with shearable precipitates but non-shearable dispersoids, vs. only shearable ppts. graph courtesy of J. Staley, Alcoa
Coarse particle effect on fatigue • Inclusions nucleate cracks cleanliness (w.r.t. coarse particles) improves fatigue life, e.g. 7475 improved by lower Fe+Si compared to 7075: 0.12Fe in 7475, compared to 0.5Fe in 7075; 0.1Si in 7475, compared to 0.4Si in 7075. graph courtesy of J. Staley, Alcoa
Alloy steel heat treatment • Increasing hardness tends to raise the endurance limit for high cycle fatigue. This is largely a function of the resistance to fatigue crack formation (Stage I in a plot of da/dN). Mobile solutes that pin dislocations fatigue limit, e.g. carbon in steel [Dieter]
Casting porosity affects fatigue • Casting tends to result in porosity. Pores are effective sites for nucleation of fatigue cracks. Castings thus tend to have lower fatigue resistance (as measured by S-N curves) than wrought materials. • Casting technologies, such as squeeze casting, that reduce porosity tend to eliminate this difference. Gravity cast versussqueeze castversuswroughtAl-7010 [Polmear]
Titanium alloys [Polmear] • For many Ti alloys, the proportion of hcp (alpha) and bcc (beta) phases depends strongly on the heat treatment. Cooling from the two-phase region results in a two-phase structure, as Polmear’s example, 6.7a. Rapid cooling from above the transus in the single phase (beta) region results in a two-phase microstructure with Widmanstätten laths of (martensitic) alpha in a beta matrix, 6.7b. • The fatigue properties of the two-phase structure are significantly better than the Widmanstätten structure (more resistance to fatigue crack formation). • The alloy in this example is IM834, Ti-5.5Al-4Sn-4Zr-0.3Mo-1Nb-0.35Si-0.6C.
*Design Considerations • If crack growth rates are normalized by the elastic modulus, then material dependence is mostly removed! [Courtney fig. 12.20] • Can distinguish between intrinsic fatigue [use Eq. 12.4 for combined elastic, plastic strain range] for small crack sizes and extrinsic fatigue [use Eq. 12.6 for crack growth rate controlled] at longer crack lengths. [fig. 12.21….] • Inspection of design charts, fig. 12.22, shows that ceramics sensitive to crack propagation (high endurance limit in relation to fatigue threshold).
*Design Considerations: 2 • Metals show a higher fatigue threshold in relation to their endurance limit. PMMA and Mg are at the lower end of the toughness range in their class. [Courtney fig. 12.22] • Also interesting to compare fracture toughness with fatigue threshold. [Courtney fig. 12.23] • Note that ceramics are almost on ratio=1 line, whereas metals tend to lie well below, i.e. fatigue is more significant criterion.
*Fatigue property map [Courtney]
*Fatigue property map [Courtney]
*Variable Stress/Strain Histories • When the stress/strain history is stochastically varying, a rule for combining portions of fatigue life is needed. • Palmgren-Miner Rule is useful: ni is the number of cycles at each stress level, and Nfi is the failure point for that stress. [Ex. Problem 12.2] * Courtney’s Eq. 12.9 is confusing; he has Nf in the numerator also