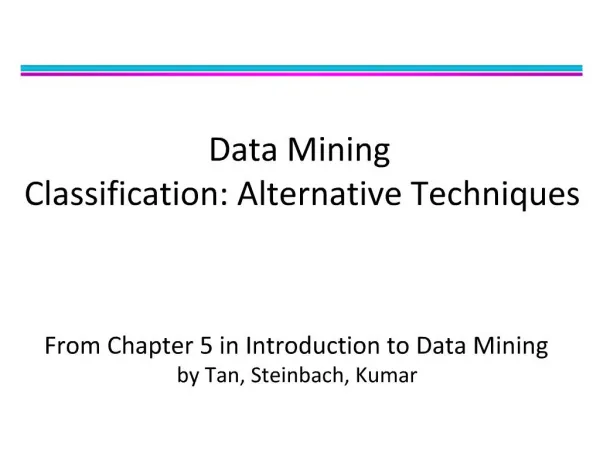
Ensemble Methods in Classification
Learn about ensemble methods such as Bagging and Boosting, how to generate an ensemble of classifiers, AdaBoost example, and methods for performance evaluation like ROC curves and learning curves.

Ensemble Methods in Classification
E N D
Presentation Transcript
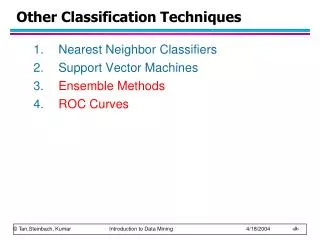
Other Classification Techniques • Nearest Neighbor Classifiers • Support Vector Machines • Ensemble Methods • ROC Curves
Why does it work? • Suppose there are 25 base classifiers • Each classifier has error rate, = 0.35 • Assume classifiers are independent • Probability that the ensemble classifier makes a wrong prediction:
Examples of Ensemble Methods • How to generate an ensemble of classifiers? • Bagging • Boosting
Bagging • Sampling with replacement • Build classifier on each bootstrap sample • Each sample has probability (1 – 1/n)n of being selected
Boosting • An iterative procedure to adaptively change distribution of training data by focusing more on previously misclassified records • Initially, all N records are assigned equal weights • Unlike bagging, weights may change at the end of boosting round
Boosting • Records that are wrongly classified will have their weights increased • Records that are classified correctly will have their weights decreased • Example 4 is hard to classify • Its weight is increased, therefore it is more likely to be chosen again in subsequent rounds
Example: AdaBoost • Base classifiers: C1, C2, …, CT • Error rate: • Importance of a classifier:
Example: AdaBoost Increase weight if misclassification; Increase is proportional to classifiers Importance. • Weight update: • If any intermediate rounds produce error rate higher than 50%, the weights are reverted back to 1/n and the re-sampling procedure is repeated • Classification:
Basic AdaBoost Loop (Alg. 5.7 textbook) D1= initial dataset with equal weights FOR i=1 to k DO Learn new classifier Ci; Computer ai; Update example weights; Create new training set Di+1 (using weighted sampling) END FOR Return Ensemble classifier that uses Ciweighted by ai (i=1,k)
Initial weights for each data point Data points for training Illustrating AdaBoost
Methods for Performance Evaluation • How to obtain a reliable estimate of performance? • Performance of a model may depend on other factors besides the learning algorithm: • Class distribution • Cost of misclassification • Size of training and test sets
Learning Curve • Learning curve shows how accuracy changes with varying sample size • Requires a sampling schedule for creating learning curve: • Arithmetic sampling(Langley, et al) • Geometric sampling(Provost et al) Effect of small sample size: • Bias in the estimate • Variance of estimate
ROC (Receiver Operating Characteristic) • Developed in 1950s for signal detection theory to analyze noisy signals • Characterize the trade-off between positive hits and false alarms • ROC curve plots TP (on the y-axis) against FP (on the x-axis) • Performance of each classifier represented as a point on the ROC curve • changing the threshold of algorithm, sample distribution or cost matrix changes the location of the point
At threshold t: TP=0.5, FN=0.5, FP=0.12, FN=0.88 ROC Curve - 1-dimensional data set containing 2 classes (positive and negative) - any points located at x > t is classified as positive
ROC Curve (TP,FP): • (0,0): declare everything to be negative class • (1,1): declare everything to be positive class • (1,0): ideal • Diagonal line: • Random guessing • Below diagonal line: • prediction is opposite of the true class
Using ROC for Model Comparison • No model consistently outperform the other • M1 is better for small FPR • M2 is better for large FPR • Area Under the ROC curve • Ideal: • Area = 1 • Random guess: • Area = 0.5
How to Construct an ROC curve • Use classifier that produces posterior probability for each test instance P(+|A) • Sort the instances according to P(+|A) in decreasing order • Apply threshold at each unique value of P(+|A) • Count the number of TP, FP, TN, FN at each threshold • TP rate, TPR = TP/(TP+FN) • FP rate, FPR = FP/(FP + TN)
How to construct an ROC curve Threshold >= + + - - - + - + - + - ROC Curve: + -