Other Multivariate Techniques
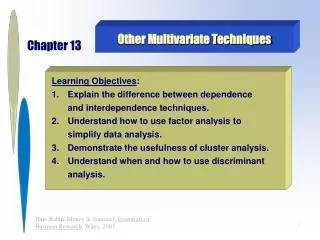
Chapter 13. Other Multivariate Techniques. Learning Objectives : Explain the difference between dependence and interdependence techniques. Understand how to use factor analysis to simplify data analysis. Demonstrate the usefulness of cluster analysis.

Other Multivariate Techniques
E N D
Presentation Transcript
Chapter 13 Other Multivariate Techniques Learning Objectives: • Explain the difference between dependence and interdependence techniques. • Understand how to use factor analysis to simplify data analysis. • Demonstrate the usefulness of cluster analysis. • Understand when and how to use discriminant analysis.
Dependence vs. Interdependence Techniques Dependence Techniques = variables are divided into independent and dependent sets for analysis purposes. Interdependence Techniques = instead of analyzing both sets of variables at the same time, we only examine one set. Thus, we do not compare independent and dependent variables.
Factor Analysis What is it? Why use it? ?
Factor Analysis . . . . an interdependence technique that combines many variables into a few factors to simplify our understanding of the data.
Exhibit 13-1 Ratings of Fast Food Restaurants Respondent Taste Portion Freshness Friendly Courteous Competent Size #1 9 8 7 4 3 4 #2 8 7 8 4 5 3 #3 7 8 9 3 4 3 #4 8 9 7 4 4 3 #5 7 8 7 3 3 3 #6 9 7 8 5 4 5
Exhibit 13-2 Factor Analysis of Selection Factors On Line http://www.burgerking.com http://www.mcdonalds.com
What can we do with factor analysis? • Identify the structure of the relationships among either variables or respondents. • Identify representative variables from a much larger set of variables for use in subsequent analysis. • Create an entirely new set of variables for use in subsequent analysis.
Using Factor Analysis • Extraction Methods • Number of Factors • Factor Loadings/Interpretation • Using with Other Techniques
Extraction Methods: • Variance Considerations. • Component Analysis • Common Factor • Rotation Approaches. • Orthogonal • Oblique
Exhibit 13-3 Types of Variance in Factor Analysis Error Variance Unique Variance Common Variance Principal Components Analysis Common Factor Analysis
Component vs. Common? Two Criteria: 1. Objectives of the factor analysis. 2. Amount of prior knowledge about the variance in the variables.
Exhibit 13-4 Orthogonal and Oblique Rotation of Factors 987897y98hojhkyuiyiuhbjk F2 Unrotated F2 Orthogonal Rotation F2 Oblique Rotation X4 .5 X5 X6 1.0 F1 0 .5 X3 X2 X1 F1 Oblique Rotation F1 Orthogonal Rotation
Comparison of Factor Analysis and Cluster Analysis Variables 1 2 3 Respondent A 7 6 7 B 6 7 6 C 4 3 4 D 3 4 3 7 6 5 4 3 2 1 Respondent A Respondent B Score Respondent C Respondent D
Assumptions: • Multicollinearity. • Measured by MSA (measure of sampling adequacy). • Homogeneity of sample.
Number of Factors? • Latent Root Criterion • Percentage of Variance
Which Factor LoadingsAre Significant? • Customary Criteria = Practical Significance. • Sample Size & Statistical Significance. • Number of Factors and/or Variables.
Guidelines for Identifying Significant Factor Loadings Based on Sample Size Factor Loading Sample Size Needed for Significance* .30 350 .35 250 .40 200 .45 150 .50 120 .55 100 .60 85 .65 70 .70 60 .75 50 *Significance is based on a .05 significance level , a power level of 80 percent, and standard errors assumed to be twice those of conventional correlation coefficients.
Exhibit 13-5 Example of Varimax-Rotated Principal Components Factor Matrix
Exhibit 13-7 Descriptive Statistics for Customer Survey Descriptive Statistics
Exhibit 13-8 Rotated Factor Solution for Customer Survey Perceptions
Exhibit 13-8 Rotated Factor Solution for Customer Survey Perceptions Continued
Interpreting the Factor Matrix Steps: • Examine the Factor Matrix of Loadings. • Identify the Highest Loading for Each Variable. • Assess Communalities of the Variables. • Label the Factors.
Using Factor Analysis with Other Multivariate Techniques Select Surrogate Variables? Create Summated Scales? Compute Factor Scores?
Cluster Analysis Overview • What is it? • Why use it?
Cluster Analysis . . . an interdependence technique that groups objects (respondents, products, firms, variables, etc.) so that each object is similar to the other objects in the cluster and different from objects in all the other clusters.
Exhibit 13-9 Three Clusters of Shopper Types LowFrequency of Looking for Low Prices High 3 1 2 Low Frequency of Using Coupons High
Scatter Diagram for Cluster Observations Level of Education High Low Low High Brand Loyalty
Scatter Diagram for Cluster Observations High Low Low High Level of Education Brand Loyalty
Scatter Diagram for Cluster Observations Level of Education High Low Low High Brand Loyalty
Exhibit 13-10 Between and Within Cluster Variation Within Cluster Variation Between Cluster Distances
Cluster Analysis LowIncome High “Wendy’s” “McDonald’s” “Burger King” Low Preference for Tasty Burgers High
Three Phases of Cluster Analysis: Phase One: Divide the total sample into smaller subgroups. Phase Two: Verify the subgroups identified are statistically different and theoretically meaningful. Phase Three: Profile the clusters in terms of demographics, psychographics, and other relevant characteristics.
Questions to Answer in Phase One: 1. How do we measure the distances between the objects we are clustering? 2. What procedure will be used to group similar objects into clusters? 3. How many clusters will we derive?
Research Design Considerations in Using Cluster Analysis: • Detecting Outliers • Similarity Measures • Distance • Standardizing the Data
Cluster Grouping Approaches Hierarchical Nonhierarchical Go On-Line www.dssresearch.com
Hierarchical vs. Nonhierarchical Cluster Approaches Hierarchical = develops a hierarchy or tree-like format using either a build-up or divisive approach. Nonhierarchical = referred to a K-means clustering, these procedures do not involve the tree-like process, but instead select one or more cluster seeds and then objects within a prespecified distance from the cluster seeds are considered to be in a particular cluster.
Build-up vs. Divisive Approaches Build-up = also referred to as agglomerative, it starts with all the objects as separate clusters and combines them one at a time until there is a single cluster representing all the objects. Divisive = starts with all objects as a single cluster and then takes away one object at a time until each object is a separate cluster.
Exhibit 13-11 Dendogram of Hierarchical Clustering 1 2 Object Number 3 4 5 1 2 3 4 5 Steps
Phase Two – Cluster Analysis . . . involves verifying that the identified groups are in fact statistically different and theoretically meaningful.
Phase Three – Cluster Analysis . . . examines the demographic and other characteristics of the objects in each cluster and attempts to explain why the objects were grouped in the manner they were.
HOW MANY CLUSTERS? • Run cluster; examine similarity or distance measure for two, three, four, etc. clusters? • Select number of clusters based on “a priori” criteria, practical judgement, common sense, and/or theoretical foundations.
Cluster Analysis Example Variables Used: X6 – Friendly Employees X11 – Courteous Employees X12 – Competent Employees
Exhibit 13-12 Error Coefficients for Cluster Solutions Error CoefficientsError Reduction Four Clusters = 203.529 3 – 4 Clusters = 48.089 Three Clusters = 251.618 2 – 3 Clusters = 66.969 Two Clusters = 318.587 1 – 2 Clusters = 356.143 One Cluster = 674.730
Exhibit 13-13 Characteristics of Two-Group Cluster Solution Descriptives
Exhibit 13-13 Characteristics of Two-Group Cluster Solution Continued ANOVA
Exhibit 13-14 Demographic Profiles of Two Cluster Solution Descriptives
Exhibit 13-14 Demographic Profiles of Two Cluster Solution Continued ANOVA
Discriminant Analysis ? What is it? Why use it?
Discriminant Analysis . . . . a dependence technique that is used to predict which group an individual (object) is likely to belong to using two or more metric independent variables. The single dependent variable is non-metric.
Exhibit 13-15 Two Dimensional Discriminant Analysis Plot of Restaurant Customers Less ImportantFun Place for Kids More Important “McDonald’s” “Burger King” Less Important Food Taste More Important