Rainfall Measurement
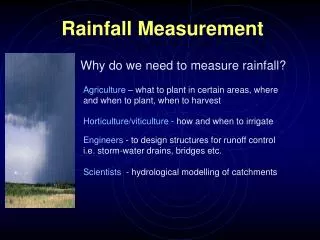
Rainfall Measurement. Agriculture – what to plant in certain areas, where and when to plant, when to harvest. Horticulture/viticulture - how and when to irrigate . Engineers - to design structures for runoff control i.e. storm-water drains, bridges etc. Why do we need to measure rainfall? .

Rainfall Measurement
E N D
Presentation Transcript
Rainfall Measurement Agriculture – what to plant in certain areas, where and when to plant, when to harvest Horticulture/viticulture - how and when to irrigate Engineers - to design structures for runoff control i.e. storm-water drains, bridges etc. Why do we need to measure rainfall? Scientists - hydrological modelling of catchments
Things to know about rainfall • Where to get rainfall information • Rainfall sites in the area of interest • Seasonal rainfall trends • Variability of rainfall across the state and between towns • Area specific rainfall • Site specific rainfall • Methods of measuring rainfall • Where to place rainfall gauges - depends on the site • How many gauges to place in area - depends on the experiment • What to do with the rainfall data
Farming Scenario What information do you need? • Seasonal rainfall • Long term average rainfall • Risk of drought • Chance of rain • Southern Oscillation Index effect on rainfall prediction
Site Specific Rainfall Information Wagin – annual rainfall distribution
Site Specific Rainfall Information Broome – annual rainfall distribution (note change in distribution of rainfall and change in scale
Site Specific Rainfall Information Rosebery West coast of Tasmania– (note change in distribution of rainfall and change in scale
Site Specific Rainfall Information Wagin – variation in rainfall
Site Specific Rainfall Information Wagin – probability of rainfall
Comparison of rainfall sites • What if you live between Wagin and Katanning? • Can you use their rainfall data to predict rainfall at your farm?
What if you need to know the rainfall in a catchment? • Measure it yourself…. • Type of rain gauges? • Where to put gauges? • How many gauges? • How do you map it?
Methods of Measuring Rainfall:Manual • Often have a funnel opening into a cylinder gauge. • Come in a variety of shapes and sizes • Calculate the rainfall (in mm) by dividing the volume of water collected by the area of the opening of the cup. (The gauge marking often accounts for this).
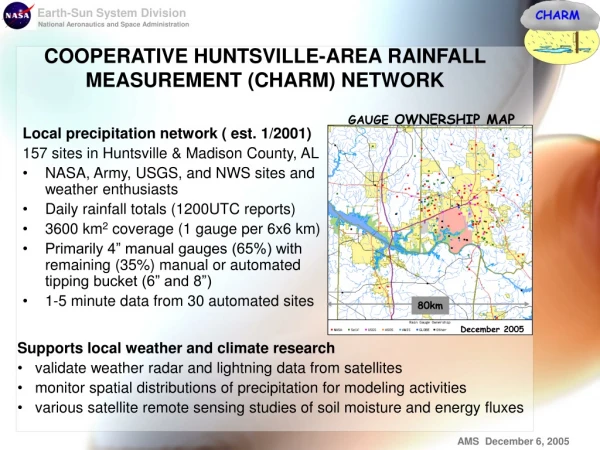
Methods of Measuring Rainfall:Remote • Tipping bucket rain gauge -The bucket tips when precipitation of 0.2 mm, 0.5 mm, 1.0 mm has been collected. Each tip is recorded by a data logger. • Weather Station - Records rainfall, but also evaporation, air pressure, air temperature, wind speed and wind direction (so can be used to estimate evapo-transpiration) • Radar - Ground-based radar equipment can be used to determine how much rain is falling and where it is the heaviest.
Placement of Rain Gauges Gauges are affected by wind pattern, eddies, trees and the gauge itself, therefore it is important to have the gauge located and positioned properly. • 1m above ground level is standard - • all gauges in a catchment should be the same height • 2 to 4 times the distance away from an isolated object (such as a tree or building) or in a forest a clearing with the radius at least the tree height or place the gauge at canopy level
Placement of Rain Gauges • shielded to protect gauge in windy sites • or if obstructions are numerous they will reduce the wind-speed, turbulence and eddies.
Placement of Rain Gauges • For sloping ground the gauge should be placed with the opening parallel to the ground • The rainfall catch volume (mm3) is then divided by the opening area that the rain can enter
Number and Distribution of Gauges Need to consider: • size of area • prevailing storm type • form of precipitation • topography • aspect • season
Distribution of Gauges • The distribution of gauges should not be random. • only fixed characteristics of areas can be sampled randomly. Random events must be sampled by a systematic arrangement of sampling points • Practical considerations of access and exposure mean that some pragmatism is required in designing a network. • It is useful to locate gauges so that isohyetal maps can be drawn. Some gauges need to be near, or outside the catchment boundary in order to cover the catchment completely.
Number of Gauges Depends on Storm type • Cyclonic storms (large areas, low intensities) -small number of gauges may be O.K. • Convective storms (local, intense, uneven distribution) -denser network needed. Convective storms may have seasonal dominance -need to consider this as well. • Orographic rainfall due to mountains (not fronts) -may need denser network than flatter area.
Based ONLY on area considerations the following tabulation has been suggested: Number of Gauges
Methods of averaging rainfall data • Arithmetic average • Theissen polygons • Isohyetal method Although, most of these calculations are done with computer mapping programs, it is still useful to understandthese methods.
Thiessen method for Mapping Rainfall This involves determining the area of influence for each station,rather than assuming a straight-line variation. It is easier than the isohyetal method but less accurate • Locate all rainfall stations on a base map and record the rainfall amount. • Connect each station by straight lines with the several nearest stations to form a series of triangles. • Erect perpendicular bisectors on each of these lines and extend them to the intersect with other bisectors, thus forming a series of irregular polygons
Thiessen method for Mapping Rainfall Measure the fraction of the catchment area in each polygon (calledthe Thiessen constant), multiply by the rainfall catch at the station within the polygon and sum to get the catchment average.
Isoheyetal method forMapping Rainfall The most basic method of representing the spatial distribution.This is generally the most accurate method but is also the mostlaborious. • Locate all rainfall stations on a base map and record the rainfall amount. • Draw isohyets (lines of equal rainfall) by proportioning the distances between adjacent gauges according to differences in catch.
Isoheyetal method forMapping Rainfall • Then calculate the mean precipitation for the area corresponding to each isohyet. • Calculate the fraction of catchment area under each isohyet, multiply by the mean precipitation for that area and sum to get the catchment average.
Computer Mapping Methods • Other mapping programs such as SURFER or GIS program ARCVIEW can be used to map rainfall at the different measurement locations. • Maps of rainfall can be produced by using the statistical analysis packages that come with the program. Statistical methods include nearest neighbour, inverse distance weighting or kriging (which uses variogram analysis). • The statistical methods produce a grid over the specified area of a specific size. The influence of the actual rainfall measurement is determined for each grid node to produce a rainfall amount at each node.
Methods of gridding or determining missing data • Arithmetic average • Normal ratio method • Inverse distance squared
Methods of determining missing data In the examples station X is the station with data missing • Arithmetic average - assign it to station X • Normal ratio method - • get observed rainfall at surrounding stations • These are weighted by the ratio of the normal annual rainfall at station X and normal annual rainfall at that station. where Px = estimation of ppt at station x, Pi = ppt at Nx = normal ppt at station X and Ni is ppt at the ith surrounding station .
Methods of determining grid data In the example station X is the station with data missing • Inverse distance squared • The closer a station is to station X the greater the weight assigned to that station's precipitation. • The inverse of the squared distance between a station and station X is used as a weighting factor in determining the rainfall at station X.
Decisions based on rainfall data? • You should know • where to get rainfall information • what rainfall information means • Therefore you can • determine best site for planting particular species • make decisions for the coming season based on rainfall averages and the SOI