Download
1 / 32
320 likes | 345 Vues
Explore the CHARM local precipitation network in Huntsville & Madison County, AL, supporting weather research, radar validation, and spatial modeling activities. Access historical data, gauge ownership map, types of rain gauges, and real-time updates. Discover applications in meteorology, hydrology studies, and climate validation with radar estimates.

E N D
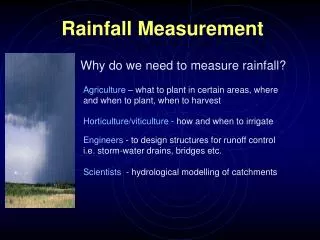
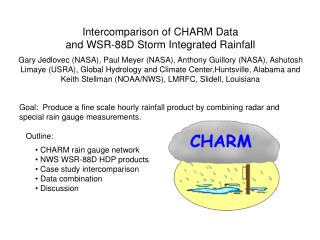
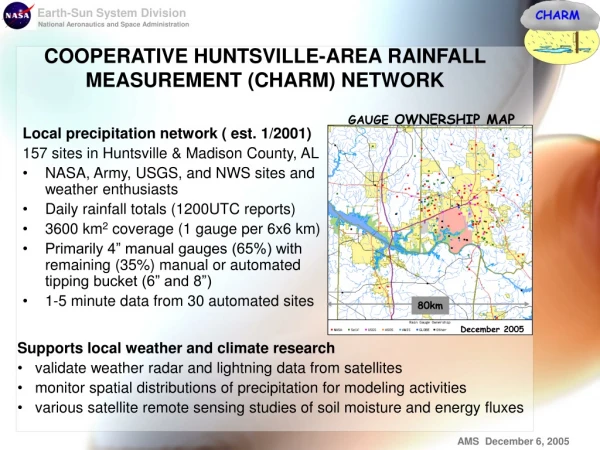
GAUGE OWNERSHIP MAP 80km December 2005 COOPERATIVE HUNTSVILLE-AREA RAINFALL MEASUREMENT (CHARM) NETWORK • Local precipitation network ( est. 1/2001) • 157 sites in Huntsville & Madison County, AL • NASA, Army, USGS, and NWS sites and weather enthusiasts • Daily rainfall totals (1200UTC reports) • 3600 km2 coverage (1 gauge per 6x6 km) • Primarily 4” manual gauges (65%) with remaining (35%) manual or automated tipping bucket (6” and 8”) • 1-5 minute data from 30 automated sites • Supports local weather and climate research • validate weather radar and lightning data from satellites • monitor spatial distributions of precipitation for modeling activities • various satellite remote sensing studies of soil moisture and energy fluxes
ACCESS TO CHARM (http://weather.msfc.nasa.gov/charm) Data entry and display Access historical data How to take measurements FAQs What’s new
TYPES OF RAIN GAUGES IN CHARM 4” non-recording “all-weather” plastic 6”, 8” non- recording (metal) 6”, 8” tipping bucket – recorded electronically 6”, 8” recording weekly paper charts
2005 Total– 157 -- 123 manual, 4 recording (manual) and 30 automated GAUGE OWNERSHIP MAP STATIONS REPORTING IN 2005 NASA 4” non-recording – 66 (41) 8” recording – 2 (2) Private individual – 44 (27) AWIS - 2 (2) USGS - 20 (13) GLOBE – 4 (4) ASOS - 2 (2) OTHER - 17 (7) However, only 88 sites reported (if even once) in 2005, about 35 regularly! December 2005 December 2001 CHARM OBSERVERS 2001 Total – 96 – 76 manual, 3 recording (manual), and 17 automated
USE AND APPLICATIONS CHARM86 – supported NASA meteorological experiment over Huntsville Existing measurements systems Aldridge Creek flood of 1999 Flooding of the AXAF clean room out at MSFC (1997) Environmental studies for MSFC Redstone Arsenal CHARM observations are part of the NWS (SHEF) data stream • LMRFC (Slidell) and SERFC (Atlanta) for hydrological studies • Local WFOs (HUN) Satellite and ground based (radar) intercomparison studies Short-term precipitation climatology studies
CHARM data has been used to validate forecast model estimates of precipitation
Forecast: 24h accumulated rainfall for April 12-13, 2001, 0700 LDT. Regional MM5 model (left) and early Eta (right) PRECIPITATION INTERCOMPARISON Validation: 24h accumulated rainfall derived from NWS radars, April 12-13, 2001, ending 7:00a LST. next
CHARM PRECIP PRECIPITATION ESTIMATE FROM RADAR CHARM data indicates smaller scale variability
CHARM data has been used to validate radar estimates of precipitation
NASHVILLE RADAR HYTOP RADAR DIGITAL PRECIPITATION PRODUCT • NWS offices produce their own precipitation estimatesfrom their local WSR-88D radar. The Nashville and Hytop (northeast of Huntsville) radars captured this storm event. • Figures present storm totals (sum of hourly product over storm lifetime ~ 4-6 hours). • Same general structure • Nashville radar - more intense / widespread rainfall • Radar calibration, elevation, scan patterns, distance from storm may all contribute to the difference. 4-5” ~3”
Irregularly spaced gauge data (from 200m to 10 km) were objectively analyzed to a uniform grid to create the image. Max= 2.96” Max=2.73” Maximum rain rate of about 2 in/hr CHARM DATA ANALYSIS • June 4-5, 2001 Case Study • Isolated heavy thunderstorm moves • through the CHARM network • Slow west-to-east movement over • Huntsville Rainfall totals reported at 1200UTC for the preceding 24h . For June 4-5, the 24h totals capture only this storm event. • Details: • Strong north-south gradient on • either side of the storm track • Width of heavy rainfall area - 10 km • Maximum of 2.96” on east of • region, secondary max (2.73”) in • the western half of network
CHARM data has been used to verify and enhance special rainfall products used for climate studies
Example of stage III radar product for June 4, 2001 over Northern Alabama Hourly stage III product summed from 2100 – 0300 UTC. NWS HDP PRODUCTS • Stage I - integrated precipitation from local radar using standard or tropical Z-R relationships on • 4 km grid – dependent on Z-R relationship used • Stage II - adjusted stage I product for bias using local (hourly) rain gauges • Stage III - combination of stage II HDP from individual radars to produce a regional precipitation estimate • minimal bias due to mis-calibration and different Z-R, local and seasonal adjustments • regional continuity and consistency Rainfall (cm) Note the dual rainfall maximum in the stage III radar product corresponds nicely both in position and magnitude to the CHARM data. CHARM Stellman et al. 2001 (Wea. Fore.)
ALL POINTS MD = 0.19” SD = 0.50” <1” > 1” MD = 0.21” 0.17” SD = 0.15” 0.60” STAGE III vs. CHARM • Resolution issues will affect comparison • Radar: • radar volume – varies with distance • 4km grid cells – arbitrary selection • Rain gauge: • point measurement – microscale variability greatest in convective storms • multiple rain gauges for each grid cell (a single best comparison used in analysis below) Comparison shows little or no bias (0.19”) between CHARM measurements and radar estimates. Scatter is considerable especially for amounts > 1.00”.
CHARM data is regularly used to evaluate short-term variations in precipitation climatology.
HUNTSVILLE DROUGHT OF 2005 OR WAS IT?Huntsville had one significant rain event from 9/1 through 11/15 (2.5 months) hottest time of year in a year with minimum Springtime rainfall? despite numerous tropical storms impinging on the ValleyYet there is significant variability between reported rainfall over the region! Only 4 real rain events in 3 months Note absence of any rain events
4.5 5.6 5.3 4.8 5.5 3.8 5.5 4.4 2.8 5.1 2.7 4.9 3.0 4.7 3.4 5.8 4.2 4.3 3.1 4.1 5.6 2.6 2.4 2.5 4.1 6.2 2.8 6.5 3.8 4.4 2.7 5.2 2.9 2.7 3.0 4.4 2.5 6.0 2.0 5.4 2.6 5.1 4.9 3.5 September 2005 November 2005 VARIABILITY IN MONTHLY RAINFALL - Fall 2005 Normal Actual RangeSeptember 4.3 2.9 (2.0 - 5.5in)October 3.5 0.1 (0.0 - 0.5in)November 5.3 3.0 (3.0 - 6.5in)Note difference in spatial variability! Does it even out over the long term? + +
CHARM 2005 selected station monthly rainfall and anomalies (departure from normal).
2005 RAINFALL • SE HSV (blue) and airport (red) show below average rainfall most months
2005 RAINFALL • SE HSV (blue) and airport (red) show below average rainfall most months • NSSTC location (orange) similar to airport trends, Big Cove area (cyan) had a surplus during the summer
2005 RAINFALL • SE HSV (blue) and airport (red) show below average rainfall most months • NSSTC location (orange) similar to airport trends, Big Cove area (cyan) had a surplus during the summer • Madison area (green) shows large summer surplus, Cullman (grey) was dry
CHARM 2005 selected station monthly rainfall anomalies and yearly deficit (sum of departure from normal).
2005 ANOMALY AND DEFICIT • At the airport (red), 2005 starts out dry and stays dry (-17+ in).
2005 ANOMALY AND DEFICIT • At the airport (red), 2005 starts out dry and stays dry (-17+ in). • SE HSV (blue) tracks airport but Big Cove area (cyan) only down -9 in for year.
2005 ANOMALY AND DEFICIT • At the airport (red), 2005 starts out dry and stays dry (-17+ in). • SE HSV (blue) tracks airport but Big Cove area (cyan) only down -9 in for year. • Summer rains keep Madison (green) with little (-3 in) deficit for the year.
CHARM 2005 rainfall deficit pattern shows large deficit throughout most of the region, however Madison and surrounding regions were not as hard hit with the drought. Are the 2005 patterns a continuation of past trends? -7.8 -2.7 -7.2 -16.3 -13.5 -17.2 -8.9 - -15.3 -14.6 2005 Deficit
CHARM can be used to look at short-term climate trends in rainfall. The following analysis highlights the 2001-2005 period.
2000 2001 2002 2003 2004 2005 2001-2005 ANOMALY/DEFICIT • 2001 was wet. 2002-2005 experience growing deficits at airport (red).
2000 2001 2002 2003 2004 2005 2001-2005 ANOMALY/DEFICIT • 2001 was wet. 2002-2005 experience growing deficits at airport (red). • NSSTC (orange) tracks airport deficit, but trend not as sharp in SE HSV (blue). Rainfall surplus grows throughout the period in Big Cove region (cyan, 13+ in).
2000 2001 2002 2003 2004 2005 2001-2005 ANOMALY/DEFICIT • 2001 was wet. 2002-2005 experience growing deficits at airport (red). • NSSTC (orange) tracks airport deficit, but trend not as sharp in SE HSV (blue). Rainfall surplus grows throughout the period in Big Cove region (cyan, 13+ in). • While Madison stays most, Cullman shows extreme drought over last 4 years.
+ -0.7 7.1 6.2 -17.7 + -9.3 -18.6 10.6 - -3.2 -25.6 2001-2005 Deficit Trends in quality controlled CHARM observations show distinctive patterns in 2001-2005 cumulative anomaly fields. Process 5-8 more sites with continuous records Need more long term precipitation observations
Long-term activity to support NASA research projects permanent (?) to support Tennessee Valley weather resources possible field program or GPM validation site Encourage long-term precipitation observations from existing participants annual CHARM meeting of all participants workshop on equipment and observation methods, scientific analysis picnic or other gathering to share experiences more recording gauges Expand network outlying areas – fill in gaps (NE Madison Co, south of River, east of HSV) weather enthusiasts FUTURE OF CHARM