Download
1 / 51
510 likes | 545 Vues
Fund managers of Quantum Mutual Fund give their perspective on the asset outlook for the mid-year 2021 for the three assets of equity, debt and gold. Find answers to questions like how is the performance post-Covid 2nd wave? What are the underlying macroeconomic indicators that could determine future prospects? How do you allocate across different assets to mitigate downside risk?<br>www.Quantumamc.com

E N D
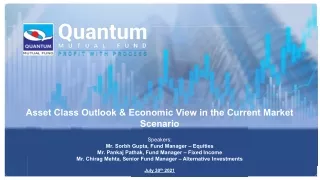
Asset Class Outlook & Economic View in the Current Market Scenario Speakers: Mr. Sorbh Gupta, Fund Manager – Equities Mr. Pankaj Pathak, Fund Manager – Fixed Income Mr. Chirag Mehta, Senior Fund Manager – Alternative Investments July 30th2021
Covid 19 – Second Wave Wanes, Vaccination Pace Slow • New covid cases has seen a sharp deceleration post a very severe second wave. Most state governments are gradually reducing restrictions India -Daily New Covid Cases India- Daily Vaccine Doses Administered 450,000 7,000,000 400,000 6,000,000 350,000 300,000 5,000,000 250,000 4,000,000 200,000 3,000,000 150,000 100,000 2,000,000 50,000 1,000,000 0 Mar-20 0 Jun-20 Sep-20 Dec-20 Mar-21 Jun-21 January-21 February-21 March-21 April-21 May-21 June-21 Source: Our world in data • As on July 15, 2021, ~23% of the population has received one dose and 5.6% have been fully vaccinated • Government is expected to fall well short of its plans to vaccinate 300 mln people by August 2021 Source: Bloomberg. As on 30thJune 2021.
Economic Activity Gradually recovering Economic activity in some sectors are at similar or higher than pre Covid-19 level May 2021 as % of Feb 2020 May 2021 as % of Feb 2020 Production Trends Credit and Consumption Trends Cement Production 79.0% Bank Credit 107.0% Steel Production 97.0% Bank credit to Industry 103.0% Fertilizer Production 95.0% 2-Wheeler Sales 44.0% Coal Production 89.0% Passenger Car Sales 40.0% Crude Oil Production 102.0% Tractor Sales 98.0% Natural Gas Production 118.0% Air Cargo 89.0% Petroleum Refinery Products 91.0% Rail Freight traffic 108.0% Electricity Generation 105.0% Port cargo 99.0% Source: CMIE
5 Corporate Profits at an all time High, Expectations of strong demand rebound • Corporate profitability hit a record in Q4FY21 driven by strong revenue growth and strict control on costs . Source: CMIE- Economic Outlook • Demand is expected to rebound post unlock driving sales, but higher input costs and normalizing other costs may see profit growth lag revenue growth
Demonetization, GST, Covid: Large Companies Getting Larger Source: CMIE- Economic Outlook, Data as of March 2021
Consensus Earnings Upgrades After Many Years of Flat Growth Source: Bloomberg. As on 30thJune 2021. Past Performance may or may not sustained in future.
Spiking PER Overstates Valuation Given The Prior Quarter’s Gap Down Source: Bloomberg. Data as on 30thJune 2021. Past Performance may or may not sustained in future.
Indians Still Consuming: The Hungry Consumers! 2-wheelers (Domestic sales Mn units) Home loans outstanding (Rs. bn) Year Passenger Vehicles (Domestic sales Mn units) Refrigerators (Production Mn units) Cement (mn tn) (March end) 8,064,903 8,439,786 10,511,009 13,302,335 15,384,261 15,753,563 16,890,778 18,433,027 18,938,727 19,928,958 23,007,691 24,460,688 20,936,201 18,397,111 2,137,881 1.6 1.6 2.0 2.5 2.6 2.7 2.5 2.6 2.8 3.1 3.3 3.4 2.7 2.5 0.4 6.1 6.7 8.0 8.7 9.9 11.1 10.7 12.0 11.9 13.1 13.5 15.6 15.0 11.2 1.3 174 187 207 216 230 248 256 270 283 280 298 337 334 294 52 2,603 2,794 3,009 3,499 3,971 4,567 5,386 6,285 7,468 8,601 9,746 11,601 13,498 14,591 14,620 2008 2009 2010 2011 2012 2013 2014 2015 2016 2017 2018 2019 2020 2021 2022 YTD * CAGR (since 2008 till 2021) 6.5% 3.8% 4.8% 4.1% 14.2% *2022 YTD data: Two-wheeler sales data as on May '21, Passenger Vehicle sales data as on May ’21, Refrigerator data as on April ’21, Cement sales data as on May' 21, Housing loans data as on May 2021, Source: 2 wheelers, Cement & passenger vehicle – CMIE database; refrigerator production data – CMIE (IIP) database; home loans outstanding – RBI Data on Sectoral deployment of Bank credit (June 2021). ** Annualized Returns
India’s Economy May Grow >6% p.a. Real GDP growth rate across 10 governments has been 6.1% p.a. over the last 41 years 6.5% is a good long-term assumption; 8% is NOT a good long-term assumption! Source: RBI and www.parliamentofindia.nic.in as of March 2021. Note: The number in red rectangle is from a changed data series starting Jan 2015. While a “superior” series, there is no comparable number to equate the “New” with the “Old”. Most economists deduct 0% to 1.5% from the “New” to equate to the “Old”; therefore under Modi, the GDP has been at 5.9% at best matching the 5.6% under the BJP-led coalition government of Vajpayee that resulted in a rout for the BJP at the time of the next election in 2004!* Please note that data used for World GDP for 2017 is a median Estimate since World Bank data is not yet available and India GDP data is governments second advance estimate released at the end of May 2021.
Foreign Investors Return as New Covid Cases Decline; Third Wave Could Again Lead to outflows Change in S&P BSE-30 TRI in that period (% ) ( % USD) +86.5% +20.5% +40.2% +51.6% +67.0% -60.8% +90.3% +24.2% -35.7% +24.1% -1.9% +29.2% -8.1% +0.9% +37.8% -2.0% +13.1% +14.5% +8.7% -1.0% +1215.7% Net Foreign Activity (USD bn) Net Local Activity (USD bn) Total Activity (USD bn) Period CY 2003 CY 2004 CY 2005 CY 2006 CY 2007 CY 2008 CY 2009 CY 2010 CY 2011 CY 2012 CY 2013 CY 2014 CY 2015 CY 2016 CY 2017 CY 2018 CY 2019 CY 2020 YTD 2021 June 2021 Cumulative 6.6 8.7 10.7 8.1 17.7 -12.0 17.5 29.4 -0.4 24.4 20.1 16.1 3.2 3.2 7.8 -4.4 14.4 23.0 8.3 2.4 0.1 -0.3 3.0 3.4 1.7 3.3 -1.2 -6.1 1.3 -3.9 -3.7 3.9 11.1 7.1 18.4 17.6 7.6 -7.5 -2.1 0.9 6.7 8.4 13.7 11.5 19.4 -8.7 16.3 23.3 0.9 20.5 16.4 20.0 14.3 10.3 26.2 13.2 22.0 15.5 6.2 3.3 202.4 53.7 256.1 Source: Sebi.gov.in, NDSL, As of June 30, 2021
13 Quantum Long Term Equity Value Fund – A Must have Equity Diversified Fund Value Oriented Equity Diversified Fund since March 2006 Well balanced portfolio: typically 25 to 40 stocks, across sectors Instrumental for Long Term Financial Goals like Retirement, Child’s Education, Child’s Marriage & Wealth Creation A disciplined research and investment process Low portfolio turnover: Buy after Conviction, Hold it for long Holds shares or cash: No derivatives, No hedging
14 Portfolio Outlook Winter crop (Rabi) production has been robust & monsoon is expected to be normal. Some of the portfolio stocks are well positioned to benefit from strong agri & rural economy High quality stocks available at reasonable valuations were added to the portfolio in the correction in February & March 2020 Higher weight in NBFC, Consumer discretionary and IT Portfolio stocks look comfortable after stress test - have strong balance-sheet or strong parentage to survive the downturn Existing cash holding will be used to add new names in case of correction
15 2021 – Boom & Bust, Evenly Poised Boom: – Real economic activity continue to revive & corporate earning upgrade happen • Real estate revives – stamp duty cut, lower interest rates spur real estate demand • Factories relocate from China to India – Foreign flows – FDI + FII driven by higher yields and faster growth Bust: – Poor Government Policy – Resurgence in Covid cases, Poor execution of Vaccine rollout – Rising Inflation could dampen Demand Recovery
Interest Rates at Historic Lows 10 year Gsec 1 year Gsec 10.0% 8.0% 6.0% 4.0% 2.0% Source – Bloomberg; Quantum Research, Data as of 30thJune 2021 Past performance may or may not sustained in future
Government Borrowing to Remain Elevated Gross borrowings Net market borrowing 14000 12000 Borrowing Amount in INR Billion Govt Borrowings jumped after Covid-19 10000 8000 6000 4000 2000 0 FY15 FY16 FY17 FY18 FY19 FY20 2021 2022 BE Source – CMIE, Indiabudget.gov.in, Quantum Research
‘Das PUT’ in Action RBI's Bond Buying 5.0 4.0 Amount in Rs. Trillion 3.0 2.0 1.0 0.0 -1.0 FY 2013 FY 2014 FY 2015 FY 2016 Gross Purchase FY 2017 FY 2018 FY 2019 Net OMO FY 2020 FY 2021 FY 2022* * FY22 data is from 1stApril 2021 till 26thJuly 2021 only. Source – RBI, Quantum Research, data as of 26thJuly 2021
Inflation breached the 6% ‘Laxman Rekha’ CPI-Headline Core-CPI 8.0% 6.0% 4.0% 2.0% 0.0% Jun-15 Jun-16 Jun-17 Jun-18 Jun-19 Dec-19 Jun-20 Jun-21 Sep-19 Dec-15 Dec-16 Dec-17 Dec-18 Dec-20 Sep-15 Sep-16 Sep-17 Sep-18 Sep-20 Mar-16 Mar-17 Mar-18 Mar-19 Mar-20 Mar-21 Source – MOSPI, Quantum Research, data as of June 2021
Do We Need Fixed Income in our Portfolio? Liquidity Income Diversification
Seeking Opportunity In The Elevated Yield Curve India India Sovereign Sovereign Yield Curve 7.5% 7.0% 6.5% 6.0% 5.5% 5.0% 4.5% 4.0% 26-Jul-21 3.5% 31-Dec-19 3.0% 3M 6M 1Y 2Y 3Y 4Y 5Y 6Y 7Y 8Y 9Y 10Y 11Y 12Y 13Y 14Y 15Y 19Y 24Y 30Y Source – Bloomberg, Quantum Research, data as of July 2021 Past performance may or may not sustained in future
Long Duration Funds are for Longer Period Crisil Composite Bond Index 16.0% 1 year Return 14.0% 3 Years Annualised Return 12.0% 10.0% 8.0% 6.0% 4.0% 2.0% 0.0% 2011 2012 2013 2014 2015 2016 2017 2018 2019 2020 2021 Source – AMFI Portal, Quantum Research, data as of 30thJune 2021 Past performance may or may not sustained in future
Credit Risk…??? Losses Are Generally Non- Recoverable • credit defaults causes permanent damage to portfolio Contagion Risk • stress in a small pocket can cause system wide problem Illiquidity • difficult to sell to meet heavy redemptions or churn portfolio Unfavorable Risk Returns Dynamics • upside is limited but downside could be severe • Low grade debt tends to struggle in slow economy & weak equity markets No Diversification
Presenting a Barbell Strategy combining Safety First Approach of Quantum Liquid Fund with Active Duration Management of Quantum Dynamic Bond Fund
Quantum Liquid Fund – Safety First ALWAYS Prioritize Safety over Returns Zero Private Corporate Debt Invests only in Government Bonds, Treasury Bill or AAA rated PSUs Low Credit Risk = Low Liquidity Risk A reasonable portion of portfolio in cash or overnight asset
Active Duration Management Quantum Dynamic Bond Fund If interest rate expected to go down If interest rate expected to rise Focus on protecting value Focus on capital appreciation Invest in short term securities to make the portfolio less sensitive to rising interest rate Invest in long term securities to which gain more when interest rate falls In all market conditions fund maintains credit risk at minimal levels by not investing in any Private Credit
In Conclusion… Safety First is the ONLY sensible approach to take for your cash balances Ride through the uncertain interest rate environment by having longer tenor Chasing the maximum possible return carries risk you do not want to take on Prudence is in lowering your returns expectation closer to market reality
Gold is a Monetary Asset – Gold has kept up with money supply growth 1600 1400 US Money Supply - M2 Gold Prices 1200 1000 800 600 400 200 Rebased = 100 0 1974 1977 1981 1985 1989 1993 1997 2001 2005 2009 2013 2017 2021 Data as of April 2021 Source: fred.stlouisfed.org Past performance may or may not sustained in future
31 Headwind: Optimism leads to risk on rally Improving macroeconomic situation isn’t good news for gold; risk appetite is improving Progress on vaccinations around the globe and reopening of economies S&P 500 Data as of July 25, 2021 Source: Investing.com Will the momentum sustain if the monetary and fiscal support wanes and beyond the pent-up demand that we have seen so far? Is optimism surrounding growth over stretched?
32 Headwind: Change in Fed stance With inflation raging, the Fed has to show awareness… The US central bank signaled it will raise rates earlier than planned in 2023. Percent change in US Consumer Price Index from a year prior Data as of May 2021. Source: Statista.com Data as of 23 July 2021. Source: fred.stlouisfed.org Premature tightening could throw economic recovery off track
33 Tailwind: Virus Mutations + Poor Vaccine Policy The highly contagious Delta variant appears to be taking hold Further Virus mutations could deliver a fresh blow to the economy and send shockwaves through financial markets Amid growing fears of a third wave, protecting and reviving their economies is still central banks' priority Liquidity may not dry out soon and could continue to fan inflation, which would be conducive for gold
34 Tailwind: Inflationary pressure likely to persist Percent change in Consumer Price Index from a year prior Data as of December 2020. Source: fred.stlouisfed.org, lynalden.com Data as of April 2021. Source: fred.stlouisfed.org If inflation is transitory, one should not expect significant rate hikes as Fed wouldn’t want to derail the recovery or increase costs of servicing the ballooning federal debt If inflation persists, the Fed will be behind the curve, triggering even higher inflation and thus lower real interest rates Even if the Fed tightens credit, the US Government continues to pursue highly inflationary policies
35 Gold’s fundamentals remain supportive Economies will need Government support in form of higher spending US to soon unveil a massive infra spending Accommodative Central banks Interest rates set to remain low until 2023 and possibly beyond Interest rate hike by central banks to lag inflation – Real interest rates to remain low to negative Central banks continue to fund deficits / asset purchases A weaker dollar Central Bank balance sheet – Total Assets Real interest rates will continue to be under pressure $ Trillion 2250 12 10 9 2000 10 8 1750 8 7 1500 6 6 1250 USD 4 5 % 1000 2 4 750 0 3 500 -2 2 1 250 -4 0 -6 0 2007 2008 2009 2010 2011 2012 2013 2014 2015 2016 2017 2018 2019 2020 2021 US -FED JAPAN - BOJ EU -ECB CHINA - PBOC Gold price US Real interest rate Data as of June 2021. Source: Bloomberg Data as of June 2021. Source: Bloomberg
Rising deficits & debt in the US are making the Dollar vulnerable Weakness and falling confidence in the dollar tends to strengthen gold Data as of March 2021. Source: fred.stlouisfed.org Data as of September 2020. Source: fred.stlouisfed.org
37 What should investors do Conflicting macro economic factors to keep gold range bound Many risks on the anvil that could support gold Fundamentals remain constructive but pressured by a risk on sentiment Investors should maintain exposure to the strategic asset class based on their asset allocation strategy Don’t go overboard; Maintain 10-15% allocation to the portfolio diversifier via Gold ETF’s
Asset Class Outlook for 2021 if Covid-19 Recedes Equities > Debt, Gold Central banks stay accommodative for some time before tapering Corporate and government balance sheets improve Strong wave of spending Increase in inflation Equities Equities Equities Equities Debt Debt Debt Debt Gold Gold Gold Gold
Asset Class Outlook for 2021 if Covid-19 Lingers Debt, Gold > Equities Lower taxes, lower GDP and higher spending will increase Government deficit Recessionary conditions: less spending Central Banks stay accommodative to boost growth Liquidity will lead to asset price inflation Equities Equities Equities Equities Debt Debt Debt Debt Gold Gold Gold Gold
41 Portfolio Impact of Diversification If you compound your money at 12% per year you are better off than an investor who makes 25% in one year and loses 20% in the next Risk-Return Equity +Debt +Gold * Equity + Debt ** Equity Debt Gold 11.13% 11.17% 12.85% 7.20% 11.30% CAGR 9.40% 13.48% 22.08% 3.28% 17.38% Annualized SD -15.51% -22.25% -36.43% -5.41% -28.67% VAR (0.21) (0.36) (0.56) (0.06) (0.25) Maximum Drawdown 0.541 0.380 0.308 0.349 0.302 Sharpe Ratio Time frame is November 2004 to June 2021. The period is taken from 2004 since the asset allocation weights are calculated based on normalizing the historical monthly equity and debt indicators. Given the normalization time frame used in the strategy, data availability for certain parameters beyond the time frame analyzed was a constraint. Compiled by Quantum AMC *Equity-Debt-Gold in ratio of 40-40-20. **Equity-Debt allocated in 60-40 range Based on Sensex Index, Crisil Composite Bond Fund Index, and Domestic Gold Prices Note: Past performance may or may not be sustained in the future The most diversified strategy yields similar returns with the lower volatility, compared to a pure equity strategy
Quantum Multi Asset Fund of Fund An example of dynamic asset allocation Equity allocation Sensex TRI 90000 65.00% 60.00% 75000 55.00% 60000 50.00% 45000 45.00% 40.00% 30000 35.00% 15000 30.00% 0 25.00% Data as of June 2021; Source: Quantum MF Note: Past performance may or may not be sustained in future.
2021- A Simple Asset Allocation Strategy to Deal with Market Cycles
Solutions to meet Sustainable Development Goals: SGD-17 = “SMILE” + WHAT IS SMILE? THE SMILE STORY OUTCOME SO FAR SMILE was born out of our desire to support credible NGOs and create a steady stream of money flow for them Since 2018, Quantum MF investors have supported 7 NGOs from diverse sectors via the SMILE facility SMILE enables Quantum MF investors to contribute 10% of their investment in eligible schemes to charities vetted by HelpYourNGO
SMILE Process Flow DONATE TO NGO’S DONATION RECEIPTS INVEST IN SMILE FACILITY Q Long Term Equity Value Fund Q Equity Fund of Funds Q Dynamic Bond Fund Q Multi Asset Fund of Funds Q Gold Savings Fund Q Liquid Fund HelpYourNGO sends donation receipts and 80G Donated to NGOs selected by investors and vetted by HelpYourNGO Liaises with NGO grantees Monitors & reviews * Q Stands for Quantum for scheme names Investors receive periodic program reports from HYNGO on the NGOs supported by them Investors receive periodic program reports from HelpYourNGO on the NGOs supported by them
Disclaimer – Terms of Use The data in this presentation are meant for general reading purpose only and are not meant to serve as a professional guide/investment advice for the readers. This presentation has been prepared on the basis of publicly available information, internally developed data and other sources believed to be reliable. Whilst no action has been suggested or offered based upon the information provided herein, due care has been taken to endeavor that the facts are accurate and reasonable as on date. Quantum AMC shall make modifications and alterations to the performance and related data from time to time as may be required as per SEBI Mutual Fund Regulations. Readers are advised to seek independent professional advice and arrive at an informed investment decision before making any investment. None of the Sponsors, the Investment Manager, the Trustee, their respective Directors, Employees, Affiliates or Representatives shall be liable for any direct, indirect, special, incidental, consequential, punitive or exemplary damages, including lost profits arising in any way from the data/information/opinions contained in this presentation. The Quantum AMC shall make modifications and alterations to the performance and related data from time to time as may be required. Please visit – www.QuantumMF.com to read scheme specific risk factors. Investors in the Scheme are not being offered a guaranteed or assured rate of return and there can be no assurance that the schemes objective will be achieved and the NAV of the scheme may go up and down depending upon the factors and forces affecting securities market. Investment in mutual fund units involves investment risk such as trading volumes, settlement risk, liquidity risk, default risk including possible loss of capital. Past performance of the sponsor / AMC / Mutual Fund does not indicate the future performance of the Scheme. Statutory Details: Quantum Mutual Fund (the Fund) has been constituted as a Trust under the Indian Trusts Act, 1882. Sponsor: Quantum Advisors Private Limited. (liability of Sponsor limited to Rs. 1,00,000/-). Trustee: Quantum Trustee Company Private Limited. Investment Manager: Quantum Asset Management Company Private Limited. The Sponsor, Trustee and Investment Manager are incorporated under the Companies Act, 1956. 30thJuly 2021 Mutual fund investments are subject to market risks, read all scheme related documents carefully.