Download
1 / 64
640 likes | 1.23k Vues
... chain of events to permit landfall of large red tides on west Florida beaches: Summer Saharan dust events ... Stony desert. Main dust source in China is the Tarim basin. Saharan ...

E N D
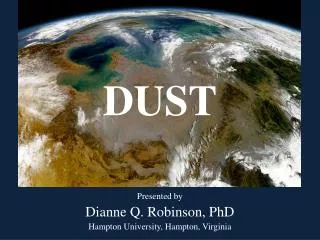
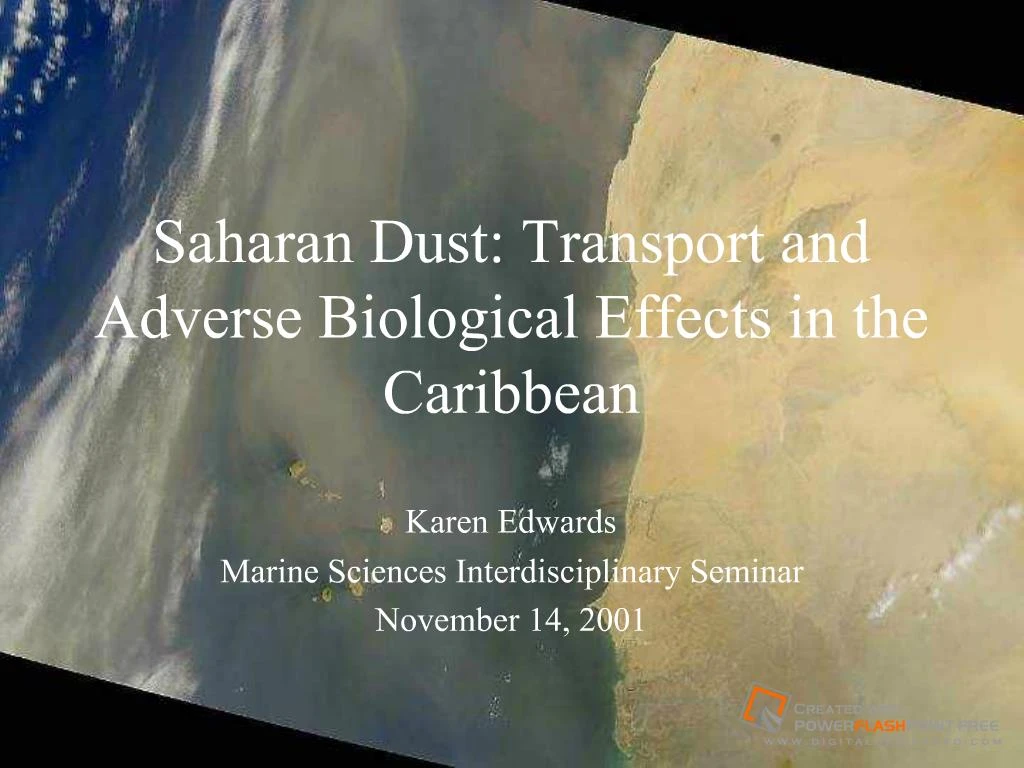
Slide 1:Saharan Dust: Transport and Adverse Biological Effects in the Caribbean
Karen Edwards Marine Sciences Interdisciplinary Seminar November 14, 2001
Slide 2:Outline
Background � Global Dust Transport of Saharan dust Source Transport/ deposition Patterns/controls of transport Adverse biological effects Caribbean sea fan disease Red tides in the Gulf of Mexico Conclusions Climate change Human health
Slide 3:Some Relative Sizes
Human Hair = 100 microns Sand = 63 microns and larger Dust = 63 microns and smaller Fungal Spores = 1 � 5 microns Bacteria = 0.2 � 15 microns Dust transported over long distances: diameter < 10 microns Saharan dust ~ 2.5 microns From: �The Secret Life of Dust� Technically, this �dust� category a geologist would divide into �silt� and �clay� where clay <4microns The sand/silt line (here at 63 microns) might also be at 60 or 50 microns. But, the Saharan dust that I will be talking about will generally be around 2.5micronsTechnically, this �dust� category a geologist would divide into �silt� and �clay� where clay <4microns The sand/silt line (here at 63 microns) might also be at 60 or 50 microns. But, the Saharan dust that I will be talking about will generally be around 2.5microns
Slide 4:~ 2,350 million US tons of dust put in atmosphere each year 35% (770 million US tons) from north Africa Perkins, 2001. About half of the total derives from natural sources, but the other half is from agriculture and other human activities.About half of the total derives from natural sources, but the other half is from agriculture and other human activities.
Slide 5:On a Global Scale, Dust
Affects radiative properties of the atmosphere, Serves as a reactive surface for atmospheric gases, Adds minerals and nutrients to ocean, Affects air quality and visibility; and Affects human health.
Slide 6:Atmospheric vs Riverine Inputs to Ocean
Units = 109 moles/yr Jickells, 1995. A 1995 study by Jickells looks at the atmospheric inputs of metals and nutrients to the oceans. While both atmospheric and riverine estimates are hampered by uncertainties (undersampling, dissolved/particulate inputs from rivers, lack of long time series and large variability) it is clear that the atmosphere is a major route by which metals and nutrients reach the ocean. N~ equal contribution Fe atmosphere much more important.A 1995 study by Jickells looks at the atmospheric inputs of metals and nutrients to the oceans. While both atmospheric and riverine estimates are hampered by uncertainties (undersampling, dissolved/particulate inputs from rivers, lack of long time series and large variability) it is clear that the atmosphere is a major route by which metals and nutrients reach the ocean. N~ equal contribution Fe atmosphere much more important.
Slide 7:Global Distribution of Deserts
From this picture, can see the deserts loosely centered around 30N and S (this is to do with Hadley cell circulation � these are the dry, downward convergence zones) The Sahara is entirely N of the equator and at the same latitude as the Caribbean and Florida.From this picture, can see the deserts loosely centered around 30N and S (this is to do with Hadley cell circulation � these are the dry, downward convergence zones) The Sahara is entirely N of the equator and at the same latitude as the Caribbean and Florida.
Slide 8:TOMS Satellite Image
TOMS = Total Ozone Mapping Spectrometer Used for detecting absorbing aerosols based on the spectral contrast at 340 and 380 nm in the upwelling ultraviolet spectrum. TOMS is sensitive to UV-absorbing aerosols such as mineral dust, volcanic ash and soot aerosol from fossil fuel combustion sources and biomass burning. Because the UV surface reflectivity is typically low and nearly constant over both land and water, TOMS can detect aerosols over continents as well as oceans. The UV spectral contrast can be used in a non-quantitative way as an aerosol index.TOMS = Total Ozone Mapping Spectrometer Used for detecting absorbing aerosols based on the spectral contrast at 340 and 380 nm in the upwelling ultraviolet spectrum. TOMS is sensitive to UV-absorbing aerosols such as mineral dust, volcanic ash and soot aerosol from fossil fuel combustion sources and biomass burning. Because the UV surface reflectivity is typically low and nearly constant over both land and water, TOMS can detect aerosols over continents as well as oceans. The UV spectral contrast can be used in a non-quantitative way as an aerosol index.
Slide 9:Saharan Dust
Slide 10:Major African Vegetation Zones
deMenocal, 1993. A closer look at west Africa and its vegetation zones. Drought and agriculture may be contributing to a change in the boundary between the Sahara and Sahel regions. Strong zonality reflects the annual avg. precipitation gradient. Precipitation is highly seasonal and associated with the African monsoon.A closer look at west Africa and its vegetation zones. Drought and agriculture may be contributing to a change in the boundary between the Sahara and Sahel regions. Strong zonality reflects the annual avg. precipitation gradient. Precipitation is highly seasonal and associated with the African monsoon.
Slide 11:Sources of Fine-grained Dust
Arid regions Ancient sedimentary basins Topographical lows Sediments from: wadis, lake and playa, alluvial fans, and alluvial floodplains ?Expect to see highly weathered particles. Prospero, 1999. Why the Saharan such an important long-range dust source. Between 5000 and 10,000 years ago, when the climate was more humid, Lake Chad was much larger (mega-Chad); it�s surface was 320m above seal level compared with 200m today. The floor of the former lake now forms a monotonous desert plain with dunes, shallow wadis, and salt flats. The soils in this region are readily deflated and dust storms are quite frequent throughout the region. Contrary to general belief, sand dunes are not usually good sources of fine particles. This point is emphasized by the observation made that TOMS sources are associated with topographical lows that suggest that wet processes are important. The size distribution of the deflated dust is a strong function of many factors including the physical properties of the soil matrix (e.g. the size distribution of the soil particles, soil moisture, cohesiveness), the condition of the surface (e.g. whether it has been disturbed, the degree of protection afforded by vegetation) and the characteristics of the wind field above the surface. Measurements in Mali, West Africa, show a bimodal distribution with one mode at 44microns in diameter and another at 5microns. Why the Saharan such an important long-range dust source. Between 5000 and 10,000 years ago, when the climate was more humid, Lake Chad was much larger (mega-Chad); it�s surface was 320m above seal level compared with 200m today. The floor of the former lake now forms a monotonous desert plain with dunes, shallow wadis, and salt flats. The soils in this region are readily deflated and dust storms are quite frequent throughout the region. Contrary to general belief, sand dunes are not usually good sources of fine particles. This point is emphasized by the observation made that TOMS sources are associated with topographical lows that suggest that wet processes are important. The size distribution of the deflated dust is a strong function of many factors including the physical properties of the soil matrix (e.g. the size distribution of the soil particles, soil moisture, cohesiveness), the condition of the surface (e.g. whether it has been disturbed, the degree of protection afforded by vegetation) and the characteristics of the wind field above the surface. Measurements in Mali, West Africa, show a bimodal distribution with one mode at 44microns in diameter and another at 5microns.
Slide 12:Size Distribution of Dust Particles
Function of many factors including: Physical properties of the soil matrix Condition of the surface, and Wind field above the surface. Prospero, 1999. The physical properties of the soil matrix: Size distribution of the soil particles; Soil moisture Cohesiveness The condition of the surface 1. Whether it has been disturbed 2. The degree of protection afforded by vegetationThe physical properties of the soil matrix: Size distribution of the soil particles; Soil moisture Cohesiveness The condition of the surface1. Whether it has been disturbed 2. The degree of protection afforded by vegetation
Slide 13:How Is Dust Mobilized?
16-17 September 1994 Karyumpudi et al., 1999 Increased dust transport in the summer large-scale dust outbreaks (2000-3000km) Within the ridge region of passing easterly wave disturbances with a periodicity of 5-7 days. Converging strong low-levelnortheasterly flow around the heatlow over arid regions in W. Africa picks up dust particles from loose topsoil as a result of the strongsurface pressure gradient induced by the cyclical passage of easterly wave disturbances. An easterly wave trough axis is located along 29W with a closed circulation centered around 9N 28W. The grayish-colored relatively cloud-free region situated behind the trough axis but north of the squall line at 15N-18W is indicative of a Saharan Over the next 24 hours, the wave trough axis progressed westward to ~34W, along with the leading edge of the dust cloud, which appears to advance slightly to the east of 30W, with max Ods>0.6 at ~22N,24W Increased dust transport in the summer large-scale dust outbreaks (2000-3000km) Within the ridge region of passing easterly wave disturbances with a periodicity of 5-7 days. Converging strong low-levelnortheasterly flow around the heatlow over arid regions in W. Africa picks up dust particles from loose topsoil as a result of the strongsurface pressure gradient induced by the cyclical passage of easterly wave disturbances. An easterly wave trough axis is located along 29W with a closed circulation centered around 9N 28W. The grayish-colored relatively cloud-free region situated behind the trough axis but north of the squall line at 15N-18W is indicative of a Saharan Over the next 24 hours, the wave trough axis progressed westward to ~34W, along with the leading edge of the dust cloud, which appears to advance slightly to the east of 30W, with max Ods>0.6 at ~22N,24W
Slide 14:The Saharan Air Layer
Karyampudi, 1999. N S A westward view (from a vantage point over E. Africa) of the objectively analyzed 3D isosurface of LITE-derived aerosol backscattering ratios (~1.05) depicted in Vis5D format. SAL may extend 5-6 km in height over west Africa due to intense solar heating in summer months. Airborne dust, which is well-mixed within the SAL, is carried westward by the prevailing easterly flow in the latitude belt of 10�-25�N. The 3D composite plume depicts a dome-shaped top as well as a slight anticyclonic curvature due to the clockwise mean flow influenced by the subtropical high as the plume spreads westward over the Atlantic. Dust outbreaks confined to the SAL Carried westward by the prevailing easterly flow (10�-25�N) Plumes originate over central Sahara and Lake Chad A westward view (from a vantage point over E. Africa) of the objectively analyzed 3D isosurface of LITE-derived aerosol backscattering ratios (~1.05) depicted in Vis5D format. SAL may extend 5-6 km in height over west Africa due to intense solar heating in summer months. Airborne dust, which is well-mixed within the SAL, is carried westward by the prevailing easterly flow in the latitude belt of 10�-25�N. The 3D composite plume depicts a dome-shaped top as well as a slight anticyclonic curvature due to the clockwise mean flow influenced by the subtropical high as the plume spreads westward over the Atlantic. Dust outbreaks confined to the SAL Carried westward by the prevailing easterly flow (10�-25�N) Plumes originate over central Sahara and Lake Chad
Slide 15:The Saharan Air Layer
Latitude = 20.5N Karyampudi, 1999. As the dust plume reaches the W. African coastline, the base of the SAL rises rapidly as it is undercut by the northeasterly trade winds (confined within the marine mixed layer) while the top subsides slowly. Perhaps due to settling of heavy dust particles from top to lower levels as the plume progresses westward. Most likely induced by the subsidence associated with the Hadley circulation. Because the temperature at the base of the SAL may be as much as 5-6C warmer than that of the air in the mixed (surface) layer below, a strong inversion is formed.As the dust plume reaches the W. African coastline, the base of the SAL rises rapidly as it is undercut by the northeasterly trade winds (confined within the marine mixed layer) while the top subsides slowly. Perhaps due to settling of heavy dust particles from top to lower levels as the plume progresses westward. Most likely induced by the subsidence associated with the Hadley circulation. Because the temperature at the base of the SAL may be as much as 5-6C warmer than that of the air in the mixed (surface) layer below, a strong inversion is formed.
Slide 16:The Saharan Air Layer
Longitude 22W Karyampudi, 1999. North-south cross section of the dust plume confirms the dome-shaped structure of the dust-layer top but also the downward bulging dust-layer bottom. The highly saturated red color (indicative of a backscattering ratio of 3.7) above the sea surface depicts the shallow but northward deepening marine mixed layer, above which the trade wind inversion(the clear layer) clearly exists to the north of the dust plume only. The higher scattering of the marine mixed layer appears to be caused largely by the combined effect of boundary layer clouds, sea salt and the residual Saharan dust aerosol. North-south cross section of the dust plume confirms the dome-shaped structure of the dust-layer top but also the downward bulging dust-layer bottom. The highly saturated red color (indicative of a backscattering ratio of 3.7) above the sea surface depicts the shallow but northward deepening marine mixed layer, above which the trade wind inversion(the clear layer) clearly exists to the north of the dust plume only. The higher scattering of the marine mixed layer appears to be caused largely by the combined effect of boundary layer clouds, sea salt and the residual Saharan dust aerosol.
Slide 17:The Saharan Air Layer � Dust Mobilization
Dust plume within easterly wave troughs SAL well-mixed, 5-6km deep Rise of the SAL bottom/sinking of top Mixing with marine layer Inversion layer due to temperature differences Middle-level jet near southern edge Maximum dust concentration in ridge-region to north of middle-level jet Karyampudi, 1999.
Slide 18:Transport Across the Atlantic
The leading and southern edges of the dust layer exhibit a distinct frontal boundary characterized by strong gradients in temperature, relative humidity and dust concentrations. These conditions lead to a rising motion to the south side of the SAL front and a sinking motion to the north within the dust layer. Air trajectories within the dust plume tend to rotate clockwise within the ridge region. The leading and southern edges of the dust layer exhibit a distinct frontal boundary characterized by strong gradients in temperature, relative humidity and dust concentrations. These conditions lead to a rising motion to the south side of the SAL front and a sinking motion to the north within the dust layer. Air trajectories within the dust plume tend to rotate clockwise within the ridge region.
Slide 19:Summer vs. Winter Atmospheric Circulation Patterns
deMenocal, 1993. Sensible and latent heating over North Africa during boreal summer drives the inflow of moisture-laden air from the adjacent eastern equatorial Atlantic. Strong southern hemisphere trade winds cross the equator and penetrate into northwest Africa, and the Intertropical Convergence Zone (ITCZ) migrates northward to ~20�N. The summer plume is centered at ~10�-25�N and its dust is derived mainly from the western and central Sahara. Dust is entrained during the passage of squall lines and is lifted to mid-tropospheric levels and transported westward near the 20�N parallel by the prevailing easterly Saharan Air Layer. Atmospheric circulation reverses in boreal winter and the ITCZ returns to 5�-10�N. NE trade winds blow over Africa and the adjacent subtropical Atlantic. Boreal winter is the dry season in the Sahel and sub-Saharan regions. The winter plum occurs between 10�N and 5�S and is associated with the trajectory of the winter NE trade winds. The winter plume dusts originate primarily in the south Sahara and Sahel regions and are transported within the lowest troposphere (500-1500m). Aerosol collection studies have demonstrated that interannual variations in dust supply to the equatorial Atlantic are related to variations in the moisture budget of the Sahel and sub-Saharan dust source areas.Sensible and latent heating over North Africa during boreal summer drives the inflow of moisture-laden air from the adjacent eastern equatorial Atlantic. Strong southern hemisphere trade winds cross the equator and penetrate into northwest Africa, and the Intertropical Convergence Zone (ITCZ) migrates northward to ~20�N. The summer plume is centered at ~10�-25�N and its dust is derived mainly from the western and central Sahara. Dust is entrained during the passage of squall lines and is lifted to mid-tropospheric levels and transported westward near the 20�N parallel by the prevailing easterly Saharan Air Layer. Atmospheric circulation reverses in boreal winter and the ITCZ returns to 5�-10�N. NE trade winds blow over Africa and the adjacent subtropical Atlantic. Boreal winter is the dry season in the Sahel and sub-Saharan regions. The winter plum occurs between 10�N and 5�S and is associated with the trajectory of the winter NE trade winds. The winter plume dusts originate primarily in the south Sahara and Sahel regions and are transported within the lowest troposphere (500-1500m). Aerosol collection studies have demonstrated that interannual variations in dust supply to the equatorial Atlantic are related to variations in the moisture budget of the Sahel and sub-Saharan dust source areas.
Slide 20:Transport Across the Atlantic
Perry et al., 1997.
Slide 21:Saharan Dust over the Caribbean
http://eol.jsc.nasa.gov/debrief/STS065/STS065-75-47.htm
Slide 22:�The wind had been for twenty-four hours previously E.N.E., and hence, from the position of the ship, the dust probably came from the coast of Africa. The atmosphere was so hazy that the visible horizon was only one mile distant.� Charles Darwin, 1845 We�ve long known that dust from Africa gets transported across the Atlantic to the Caribbean and the US. Bermuda has an extensive cover of fine-grained red clayey particles. Studies have shown that the Zr/Y Zr/ La ratios of these soils closely resembled that of the <2�m fraction of African dust; contributions from two other hypothesized sources on North America (Great Plains loess and Mississippi River Valley loess) could not be detected. Based on elemental composition of the soils on Barbados, Jamaica, the Florida Keys and the Bahamas show that African dust was the most important contributor to the soils on all of these islands. (Prospero, 1999) So, why are we just now looking at the biological effects and possible adverse biological effects? One reason is that we are just getting good estimates of the amount of dust in the atmosphere and beginning to understand it�s role. We�ve long known that dust from Africa gets transported across the Atlantic to the Caribbean and the US. Bermuda has an extensive cover of fine-grained red clayey particles. Studies have shown that the Zr/Y Zr/ La ratios of these soils closely resembled that of the <2�m fraction of African dust; contributions from two other hypothesized sources on North America (Great Plains loess and Mississippi River Valley loess) could not be detected. Based on elemental composition of the soils on Barbados, Jamaica, the Florida Keys and the Bahamas show that African dust was the most important contributor to the soils on all of these islands. (Prospero, 1999) So, why are we just now looking at the biological effects and possible adverse biological effects? One reason is that we are just getting good estimates of the amount of dust in the atmosphere and beginning to understand it�s role.
Slide 23:Average Barbados Dust Concentration
http://coastal.er.usgs.gov/african_dust/barbados.html The annual mean concentration at Barbados is ~2.5 times higher than in Miami. Or, the annual mean concentration in Miami is 40% as in Barbados. Aerosol measurements were made by two different techniques: From 1965-1970, aerosol was collected by means of 1-m2 nylon meshes suspended normal to the wind. In 1971, electricity was brought to the coastal site and all subsequent sampling was performed by drawing air through a cloth filter at a high rate of flow, The mineralogical composition of dust collected in the western Atlantic is identical to that collected off the coast of Africa � the dominant constituents are clay minerals and quartz. Kaolinite (warm, humid environments) is more prominent in the dusts from the low latitudes of west Africa and illite(mid-latitude weathering) is more prominent in dust from the Mediterranean coast. Studies show that about 1/3 to � of the dust mass was <2.5 microns in diameter. In general, the mass median diameter of mineral dust over the oceans is typically 2-3 microns.The annual mean concentration at Barbados is ~2.5 times higher than in Miami. Or, the annual mean concentration in Miami is 40% as in Barbados. Aerosol measurements were made by two different techniques: From 1965-1970, aerosol was collected by means of 1-m2 nylon meshes suspended normal to the wind. In 1971, electricity was brought to the coastal site and all subsequent sampling was performed by drawing air through a cloth filter at a high rate of flow, The mineralogical composition of dust collected in the western Atlantic is identical to that collected off the coast of Africa � the dominant constituents are clay minerals and quartz. Kaolinite (warm, humid environments) is more prominent in the dusts from the low latitudes of west Africa and illite(mid-latitude weathering) is more prominent in dust from the Mediterranean coast. Studies show that about 1/3 to � of the dust mass was <2.5 microns in diameter. In general, the mass median diameter of mineral dust over the oceans is typically 2-3 microns.
Slide 24:Increase in Dust Transport
Prospero & Nees, 1986. Drought conditions in the sub-Sahara since 1968. Highest dust associated with peaks of the droughts � 1972-73 and 1983-84. It is clear that a short period of drought does not result in an immediate and major increase in dust mobilization and transport. For example, drought began in 1968 with a severe rainfall deficit, yet dust concentrations in the summers of 1968 and 1969 were not unusually high. Lake Chad was about the size of Lake Erie in the mid-1960s but due to the drought and increased demand for water for irrigation has caused Lake Chad to shrink to 5% of that area (Perkins).Drought conditions in the sub-Sahara since 1968. Highest dust associated with peaks of the droughts � 1972-73 and 1983-84. It is clear that a short period of drought does not result in an immediate and major increase in dust mobilization and transport. For example, drought began in 1968 with a severe rainfall deficit, yet dust concentrations in the summers of 1968 and 1969 were not unusually high. Lake Chad was about the size of Lake Erie in the mid-1960s but due to the drought and increased demand for water for irrigation has caused Lake Chad to shrink to 5% of that area (Perkins).
Slide 25:Saharan Dust and the NAO
1986, Low-NAO index (0.28) 1989, High-NAO index (4.73) The NAO is defined by the difference between normalized winter sea-level atmospheric pressures between Lisbon, Portugal and Iceland. Compared to 1986, a deep Icelandic low centred around 60N is clearly shown in 1989. Winters with high NAO indices are characterized by a deepening of the Icelandic low associated with stronger Azores anticyclone. The related changes in the large-scale meteorological situation induce a northward shift of the North Atlantic westerlies which provide much of the atmospheric moisture to northern Africa and Europe. In the case of the high NAO, this shift yields drier conditions over southern Europe, the Mediterranean Sea and northern Africa. During low NAO years, precipitation is likely to be greater over the Mediterranean and large areas of North Africa, limiting the intensity both of dust uptake and transport.The NAO is defined by the difference between normalized winter sea-level atmospheric pressures between Lisbon, Portugal and Iceland. Compared to 1986, a deep Icelandic low centred around 60N is clearly shown in 1989. Winters with high NAO indices are characterized by a deepening of the Icelandic low associated with stronger Azores anticyclone. The related changes in the large-scale meteorological situation induce a northward shift of the North Atlantic westerlies which provide much of the atmospheric moisture to northern Africa and Europe. In the case of the high NAO, this shift yields drier conditions over southern Europe, the Mediterranean Sea and northern Africa. During low NAO years, precipitation is likely to be greater over the Mediterranean and large areas of North Africa, limiting the intensity both of dust uptake and transport.
Slide 26:NAO Control of Dust Export
Top line � dust concentration at Barbados. Bottom � NAO index. The annual mean of dust concentrations at Barbados generally follows the same variations as the NAO. The long-term increase of the desert dust load also corresponds to the upward trend of the NAO since the early 1970�s. Both upward trend lines are statistically significant.Top line � dust concentration at Barbados. Bottom � NAO index. The annual mean of dust concentrations at Barbados generally follows the same variations as the NAO. The long-term increase of the desert dust load also corresponds to the upward trend of the NAO since the early 1970�s. Both upward trend lines are statistically significant.
Slide 27:Summary � Saharan Dust Transport
Topographical lows produce heavily weathered particles Easterly waves in the summer pick up dust; Saharan Air Layer carries dust; ITCZ controls the latitude of transport; Correlated to rain fall deficits � controlled by the NAO
Slide 28:Biological Effects
Slide 29:Biological Effects of Saharan Dust
A significant source of primary nutrients to the ocean. Experiments have shown ocean basins may be Fe limited ? input of iron stimulates primary production. Adverse effects: Aspergillosis of sea fans (gorgonian corals) Red tides in the Gulf of Mexico Approximately 50% of the phosphorus transported to the oceans via the atmosphere is due to African dust deposition.Approximately 50% of the phosphorus transported to the oceans via the atmosphere is due to African dust deposition.
Slide 30:Sea Fan Disease
In 1983 and again in the mid-1990s a Caribbean-wide epizootic pathogen affecting the sea fans Gorgonia ventalina and G. flabellum was reported. http://earthobservatory.nasa.gov/Study/Dust/
Slide 31:Sea Fan Disease
Nagelkerken et al., 1997. Incidence = % diseased sea fans per site Virulence = mean % tissue lost per site The Curacao and Saba sites were tested in November 1995 and again in June 1996 with little change in incidence or virulence between them. This would fit in the with Saharan Dust theory in that more fungus would be delivered in the summer.Incidence = % diseased sea fans per site Virulence = mean % tissue lost per site The Curacao and Saba sites were tested in November 1995 and again in June 1996 with little change in incidence or virulence between them. This would fit in the with Saharan Dust theory in that more fungus would be delivered in the summer.
Slide 32:Sea Fan Disease
Nagelkerken et al., 1997. Sites where infection was reported. The numbered sites are study sites, the *�s are additional reports.Sites where infection was reported. The numbered sites are study sites, the *�s are additional reports.
Slide 33:Sea Fan Disease
The pathogenic agent: soil fungus Aspergillus sydowii. Does not reproduce in seawater. Shinn et al., 2000., Weir et al., in press. Sporulation experiments have since shown that hyphal fragments can sporulate at the air/seawater interface, but widespread distribution of spores via surface waters seems severely limitedSporulation experiments have since shown that hyphal fragments can sporulate at the air/seawater interface, but widespread distribution of spores via surface waters seems severely limited
Slide 34:Microbial data of air samples collected on St. John, USVI
July 23 Dust 12 isolates: 4 plant pathogens July 26 Dust 35 isolates: 7 plant pathogens Griffen et al., 2001. July 18-26, 10% Sphingomonas spp. (cause of white plague) July 18-26, 10% Sphingomonas spp. (cause of white plague)
Slide 35:Microbial data of air samples collected on St. John, USVI
Griffen et al., 2001.
Slide 36:Microbial Data of Air Samples
Cultivatable organisms: 0.23/liter cultivatable microbes in dust season. 0.01/liter cultivatable microbes in non-dust season. Organisms from dust caused disease in healthy sea fans. Griffen et al, 2001, Weir et al, in press. #/liter of air sampled#/liter of air sampled
Slide 37:Red Tides: Florida Red Tide Bloom of Gymnodinium breve
Two recent studies (Walsh and Steidinger, and Lenes et al.) link red tides on the west Florida shelf in the gulf of Mexico to Saharan mineral dust. Over the past century, the seasonal duration of red tides each year off west Florida has varied from none to 12 months with >80% of the blooms apparently occurring in late summer-fall. Background abundances of G. breve <= 1 x 10³ cells/L in the Gulf of Mexico At population levels of 1 x 10⁵ cells/L or a biomass of >1 �g chl/L, discolorations, fish and manatee kills, neurotoxic shellfish poisoning and respiratory irritation of humans ensue within near-shore waters. Two recent studies (Walsh and Steidinger, and Lenes et al.) link red tides on the west Florida shelf in the gulf of Mexico to Saharan mineral dust. Over the past century, the seasonal duration of red tides each year off west Florida has varied from none to 12 months with >80% of the blooms apparently occurring in late summer-fall. Background abundances of G. breve <= 1 x 10³ cells/L in the Gulf of Mexico At population levels of 1 x 10⁵ cells/L or a biomass of >1 �g chl/L, discolorations, fish and manatee kills, neurotoxic shellfish poisoning and respiratory irritation of humans ensue within near-shore waters.
Slide 38:Saharan Dust and Florida Red Tides
Walsh and Steidinger propose a causal chain of events to permit landfall of large red tides on west Florida beaches: Summer Saharan dust events Sufficient rainfall Dissolution of aeolian iron Seed stocks of both T. erythraeum and G. breve Release of DON to all dinoflagellate competitors Selective grazing stress on other dinoflagellates as well as diatoms, and Onshore flows to complete landfall. This paper, along with Lenes et al, are early work in linking this chain of events. The Lenes paper gives the results of ECOHAB cruises and concentrates on the Trichodesmium blooms. This paper, along with Lenes et al, are early work in linking this chain of events. The Lenes paper gives the results of ECOHAB cruises and concentrates on the Trichodesmium blooms.
Slide 39:1. Dust Concentration at Miami
Lenes et al., 2001.
Slide 40:2. Miami Rainfall
Lenes et al., 2001.
Slide 41:3. Atmospheric vs Riverine Fe Input
Duce and Tindale, 1991. The 10% dissolution rate of Fe from the atmosphere is conservative � it has been shown that from 10-50% of the Fe dissolves.The 10% dissolution rate of Fe from the atmosphere is conservative � it has been shown that from 10-50% of the Fe dissolves.
Slide 42:3. Fe(II) vs. Fe(III)
Duce and Tindale, 1991. One possible reason for this is that the Fe(II) in the remote marine aerosols is simply small-particle Fe(II) produced in the source region. This small-particle Fe(II) becomes increasingly important as large particles that may contain little Fe(II) are lost during long-range transport. The above is unlikely as the concentration of a known small-particle element, Pb, changes by a factor of over 100 from urban areas in China to the central North Pacific, while the Fe(II) changes by a factor of ~1-10. Thus transformation of the Fe from Fe(III) to Fe(II) is likely taking place during the long-range transport.One possible reason for this is that the Fe(II) in the remote marine aerosols is simply small-particle Fe(II) produced in the source region. This small-particle Fe(II) becomes increasingly important as large particles that may contain little Fe(II) are lost during long-range transport. The above is unlikely as the concentration of a known small-particle element, Pb, changes by a factor of over 100 from urban areas in China to the central North Pacific, while the Fe(II) changes by a factor of ~1-10. Thus transformation of the Fe from Fe(III) to Fe(II) is likely taking place during the long-range transport.
Slide 43:3. Photoreduction of Fe(III)
At a pH of ~2.5-5 the following reaction may produce Fe(II): [Fe(OH)(H2O)5]2+ + H2O hv>[Fe(H2O6)]2++(OH)aq Duce and Tindale, 1991.
Slide 44:4. ECOHAB Cruise Track
Lenes et al., 2001. The Ecology of Harmful Algal Blooms (ECOHAB) monthly cruise tracks on the central west Florida Shelf. In general, the results will be presented for Stations 11-22 (or greater than 50m isobath) and near-shore stations.The Ecology of Harmful Algal Blooms (ECOHAB) monthly cruise tracks on the central west Florida Shelf. In general, the results will be presented for Stations 11-22 (or greater than 50m isobath) and near-shore stations.
Slide 45:4. Cruise Results
Large red tide of > 5 x 10⁶ cells/L in October 1999 Lenes et al., 2001. Spatially, an iron minimum corresponds to Tricho populations � implies removal of dissolved iron from the surface waters as the summer Tricho populations grow. A similar relation was observed between dissolved iron & Tricho populations across the Great Barrier Reef (Jones et al., 1986) A large red tide of >5 x 10⁶ cells/L was observed in October 99. August 99 salinities >34.5 compared to August 98 salinities of ~31.0 on the outer shelf indicating the presence of Mississippi River water during Aug 98 but not Aug 99. Background abundances of G. breve <= 1 x 10³ cells/L in the Gulf of Mexico At population levels of 1 x 10⁵ cells/L or a biomass of >1 �g chl/L, discolorations, fish and manatee kills, neurotoxic shellfish poisoning and respiratory irritation of humans ensue within near-shore waters.Spatially, an iron minimum corresponds to Tricho populations � implies removal of dissolved iron from the surface waters as the summer Tricho populations grow. A similar relation was observed between dissolved iron & Tricho populations across the Great Barrier Reef (Jones et al., 1986) A large red tide of >5 x 10⁶ cells/L was observed in October 99. August 99 salinities >34.5 compared to August 98 salinities of ~31.0 on the outer shelf indicating the presence of Mississippi River water during Aug 98 but not Aug 99. Background abundances of G. breve <= 1 x 10³ cells/L in the Gulf of Mexico At population levels of 1 x 10⁵ cells/L or a biomass of >1 �g chl/L, discolorations, fish and manatee kills, neurotoxic shellfish poisoning and respiratory irritation of humans ensue within near-shore waters.
Slide 46:5. Bloom Dynamics
July 1999 total dissolved iron = 16 nmol/kg Trichodesmium surface stock of 20 colonies/L. DON reached 15-20�M This organic nitrogen could have supported the red tide of >20�g chl/L of the toxic dinoflagellate, Gymnodinium breve, found on the West Florida Coast during October 1999. Lenes et al., 2001. Trichodesmium response was a 100-fold increase in biomass over background biomass, reaching a surface stock of 20 colonies/L. DON associated with the bloom reached 15-20�M (3-4 times greater than background and much larger than ambient NO3 concentrations of <0.5�mol/kg. If all DON is converted to urea and ammonium, this organic nitrogen could have supported the red tide of >20�g chl/L of the toxic dinoflagellate, Gymnodinium breve, found on the West Florida Coast during October 1999. Trichodesmium response was a 100-fold increase in biomass over background biomass, reaching a surface stock of 20 colonies/L. DON associated with the bloom reached 15-20�M (3-4 times greater than background and much larger than ambient NO3 concentrations of <0.5�mol/kg. If all DON is converted to urea and ammonium, this organic nitrogen could have supported the red tide of >20�g chl/L of the toxic dinoflagellate, Gymnodinium breve, found on the West Florida Coast during October 1999.
Slide 47:Iron Limitation of Trichodesmium
Molar particulate N/Fe ratios: 465 for Trichodesmium ~5,000 for nitrate-using diatoms ~16,000 for smaller ammonium-using dinoflagellates Trichodesmium : severe Fe limitation kFe of ~1.0 nmol Fe/kg background levels <0.1 nmol Fe/kg Walsh and Steidinger, 2001.
Slide 48:Time Series of Tricho. and G. breve
Walsh and Steidinger, 2001. Alongshore weekly means of the T. erythraeum (dotted line) and G. breve (solid line) surface abundances within 9 km of the west Florida coast. Time series are from data from: US Fish and Wildlife Conservation Commission, the Florida Fish Wildlife Conservation,Alongshore weekly means of the T. erythraeum (dotted line) and G. breve (solid line) surface abundances within 9 km of the west Florida coast. Time series are from data from: US Fish and Wildlife Conservation Commission, the Florida Fish Wildlife Conservation,
Slide 49:Saharan Dust and Florida Red Tides
Walsh and Steidinger propose a causal chain of events to permit landfall of large red tides on west Florida beaches: Summer Saharan dust events Sufficient rainfall Dissolution of aeolian iron Seed stocks of both T. erythraeum and G. breve Release of DON to all dinoflagellate competitors Selective grazing stress on other dinoflagellates as well as diatoms, and Onshore flows to complete landfall. Just to go back to the chain of events, it is apparent that 1) is happening, dust is delivered. 2) The more rainfall will deposit more dust into the Gulf of Mexico 3) The transformation of Fe(III) to Fe(II) makes it more soluble. 4) Assuming that seed stocks of T. erythraeum are on the shelf, the new dissolved iron would reduce its iron limitation, allow a bloom and production of sufficient Nitrogen to support a large red tide. Need more work on the transport processes � is the Loop Current bringing the seed stocks? How are they transported on-shore. This chain doesn�t explain all red tides � what other causes?Just to go back to the chain of events, it is apparent that 1) is happening, dust is delivered. 2) The more rainfall will deposit more dust into the Gulf of Mexico 3) The transformation of Fe(III) to Fe(II) makes it more soluble. 4) Assuming that seed stocks of T. erythraeum are on the shelf, the new dissolved iron would reduce its iron limitation, allow a bloom and production of sufficient Nitrogen to support a large red tide. Need more work on the transport processes � is the Loop Current bringing the seed stocks? How are they transported on-shore. This chain doesn�t explain all red tides � what other causes?
Slide 50:Conclusions
Main conclusion is that there is still a lot of work to be done. It is apparent that the transport of dust has greatly increased at the same time that coral disease became widespread in the Caribbean.Main conclusion is that there is still a lot of work to be done. It is apparent that the transport of dust has greatly increased at the same time that coral disease became widespread in the Caribbean.
Slide 51:Conclusions
Transport of dust well-established Controlled by NAO Increased Desertification Adverse Biological Effects Pathogens in the dust Aspergillus in sea fans White plague bacteria Iron in the dust Red Tides in the Gulf of Mexico More work needs to be done Whereas it is likely that coral bleaching is a direct result of elevated water temperature, a possible link between zooxanthellae expulsion, elevated water temperature and dust delivery of pathogens and nutrients needs to be investigated. One study in the Mediterranean found that a pathogen the bacterium Vibrio shiloi was the cause of bleaching in the Mediterranean coral species Oculina patagonica. The authors point out that elevated water temperatures enhance the growth rate of the bacteria, thus elevating its pathogenicity towards O. patagonicaWhereas it is likely that coral bleaching is a direct result of elevated water temperature, a possible link between zooxanthellae expulsion, elevated water temperature and dust delivery of pathogens and nutrients needs to be investigated. One study in the Mediterranean found that a pathogen the bacterium Vibrio shiloi was the cause of bleaching in the Mediterranean coral species Oculina patagonica. The authors point out that elevated water temperatures enhance the growth rate of the bacteria, thus elevating its pathogenicity towards O. patagonica
Slide 52:Climate Effects
Saharan dust �cools� climate warming estimates. Dust clouds - suppress rainfall making dry conditions even drier. www.gsfc.nasa.gov/gsfc/earth/ According to recent NASA studies, scientists have found that Saharan dust particles absorb much less solar radiation than previously thought, reducing the amount of solar warming of the Earth�s surface. Normal rainfall droplet creation involves water vapor condensing on particles in clouds. The droplets eventually coalesce together to form drops large enough to fall to Earth. However, as more and more dust particles (aerosols) enter a rain cloud, the same amount of water becomes spread out. These smaller water droplets scatter and are prevented from coalescing and growing large enough for a raindrop.According to recent NASA studies, scientists have found that Saharan dust particles absorb much less solar radiation than previously thought, reducing the amount of solar warming of the Earth�s surface. Normal rainfall droplet creation involves water vapor condensing on particles in clouds. The droplets eventually coalesce together to form drops large enough to fall to Earth. However, as more and more dust particles (aerosols) enter a rain cloud, the same amount of water becomes spread out. These smaller water droplets scatter and are prevented from coalescing and growing large enough for a raindrop.
Slide 53:Effects on Human Health
1997 EPA PM 2.5 standard NIH identifies airborne dust as the primary source of allergic stress worldwide 17-fold increase Barbados asthma 1973-1996 Griffen et al., 2001.
Slide 54:Thanks
Eugene Shinn, and Garriett Smith for sending papers. Marc Alperin, John Bane, Conrad Neumann, Hans Paerl, Cisco Werner Alfredo Arechavaleta, Sarah Carr, Melanie Meaux, Melissa Southwell
Slide 55:References
Slide 56:The Loop Current
http://www.rsmas.miami.edu/~ryan/oc/atlantic/loop-current.html The Loop current is variable both in terms of position and transport. It has two extremes in its position. At one extreme, the Loop Current has an almost direct path to the Florida Current. At the other extreme it will extrude into the Gulf of Mexico forming an intense clockwise flow as far north as 29.1�N. Occasionally this loop will reach extremes with positions reaching as high as the Mississippi river delta or Florida continental shelf. On average the Loop Current is within the DeSoto Canyon region at ~30N about 5-10% of the time (I.e., 1 month of the year when wet deposition of Saharan dust loadings must also occur to yield the red tides found there.) At the edge of the shelf south of Tampa Bay, the Loop Current is present 30-35% of the time at 27N, providing seed cyanophyte populations more frequently. 38% of the red tides were observed off Central Florida. The Loop Current may bring seed stocks of Trichodesmium and G. breve to the west Florida shelf and it will affect the transport of the blooms shoreward. The Loop current is variable both in terms of position and transport. It has two extremes in its position. At one extreme, the Loop Current has an almost direct path to the Florida Current. At the other extreme it will extrude into the Gulf of Mexico forming an intense clockwise flow as far north as 29.1�N. Occasionally this loop will reach extremes with positions reaching as high as the Mississippi river delta or Florida continental shelf. On average the Loop Current is within the DeSoto Canyon region at ~30N about 5-10% of the time (I.e., 1 month of the year when wet deposition of Saharan dust loadings must also occur to yield the red tides found there.)At the edge of the shelf south of Tampa Bay, the Loop Current is present 30-35% of the time at 27N, providing seed cyanophyte populations more frequently. 38% of the red tides were observed off Central Florida. The Loop Current may bring seed stocks of Trichodesmium and G. breve to the west Florida shelf and it will affect the transport of the blooms shoreward.
Slide 57:Processes to Create Fine-grained Dust
Precipitation in the highlands weathers rocks and soils. Fine particles are carried downstream to the basin and deposited in river channels and wadis. In the dry season, the deposits become exposed, dry out, crack and flake. When wind velocity increases, the disrupted soil surface is easily deflated, and clouds of fine-grained dust are carried away. ?Expect to see highly weathered particles. Prospero, 1999.
Slide 58:Diadema 1983 Die-off
In January 1983 there was a mass mortality of Diadema on the Caribbean coast of Panama; By September 1983 this mortality had extended to many other areas of the Caribbean. Population densities of Diadema were reduced to 1.1- 5.8% of their previous levels in Panama, 1% in Jamaica and 0.6% in Cura�ao. Lessios, 1984. http://coastal.er.usgs.gov/african_dust/diadema.html 3 lines of evidence suggest that this causative agent is a pathogen rather than a pollutant or a mass of water with abnormal physical characteristics: Mortality of Diadema spread from Panama through the Yucatan and Florida Straits without any dissipation of its severity; yet none of the other six species of sea urchins coexisting with it has suffered unusual mortality in any locality � it is difficult to imagine a pollutant so toxic it could remain lethal over such a wide area yet so specific that it only affected a few species. Water temperature and salinity in Panama did not undergo any abnormal fluctuations during the time of Diadema mass mortality. Although loss of zooxanthellae and death of some corals occurred in a few areas of the Caribbean in 1983, this phenomenon did not follow the spatial and temporal sequence of Diadema mortality (Lessios) 3 lines of evidence suggest that this causative agent is a pathogen rather than a pollutant or a mass of water with abnormal physical characteristics: Mortality of Diadema spread from Panama through the Yucatan and Florida Straits without any dissipation of its severity; yet none of the other six species of sea urchins coexisting with it has suffered unusual mortality in any locality � it is difficult to imagine a pollutant so toxic it could remain lethal over such a wide area yet so specific that it only affected a few species. Water temperature and salinity in Panama did not undergo any abnormal fluctuations during the time of Diadema mass mortality. Although loss of zooxanthellae and death of some corals occurred in a few areas of the Caribbean in 1983, this phenomenon did not follow the spatial and temporal sequence of Diadema mortality (Lessios)
Slide 59:Diadema Mass Mortality
Initial outbreaks of Diadema mortality followed Caribbean surface water circulation. September 1983, die-offs occurred at Barbados, upstream from any affected areas. Any waterborne pathogen responsible for killing the Diadema would also be subject to this transport. Any waterborne pathogen responsible for killing the Diadema would also be subject to this transport.
Slide 60:Caribbean Transport
A dust-born pathogen: Impact Panama in January and By summer affect the entire Caribbean. Provide a source of the pathogen to Barbados and other isolated regions. Shinn et al., 2000 Roberts, 1997. This picture shows 1 and 2 month larval import and export assuming passive transport with the currents. Not all islands and regions are connected within short time frames. In fact, there is no current that would take the pathogen back to Barbados in order to affect that area in September.This picture shows 1 and 2 month larval import and export assuming passive transport with the currents. Not all islands and regions are connected within short time frames. In fact, there is no current that would take the pathogen back to Barbados in order to affect that area in September.
Slide 61:Theories
Sedimentation, runoff from land, sewage, pollution, ship groundings, temperature, etc. New hypothesis: Saharan dust is a contributor to coral reef decline. (Shinn, 2000).
Slide 62:Barbados Mineral Dust Annual Average and Benchmark Caribbean Events
http://coastal.er.usgs.gov/african_dust/barbados.html
Slide 63:The ITCZ
Slide 64:Australian, Gobi and Saharan Dusts
Australia particle size modes 8 & 12 �m highly aggregated soil large quantities of clay pellets The Gobi Stony desert Main dust source in China is the Tarim basin Saharan mode at 2-3�m Prospero, 1999.