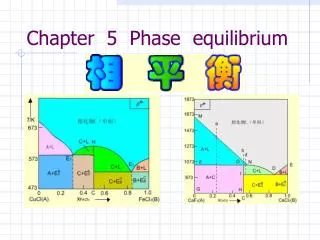
Chapter 5 Phase equilibrium
Chapter 5 Phase equilibrium. 5 Phase equilibrium. 5.1 Introduction 5.2 Equilibrium condition of heterogeneous system 5.3 Phase rule 5.4 Phase diagram of single component 5.5 Phase diagram of two components 5.6 Phase diagram of three components. 5.1 Introduction.

Chapter 5 Phase equilibrium
E N D
Presentation Transcript
5 Phase equilibrium 5.1 Introduction 5.2 Equilibrium condition of heterogeneous system 5.3 Phase rule 5.4 Phase diagram of single component 5.5 Phase diagram of two components 5.6 Phase diagram of three components
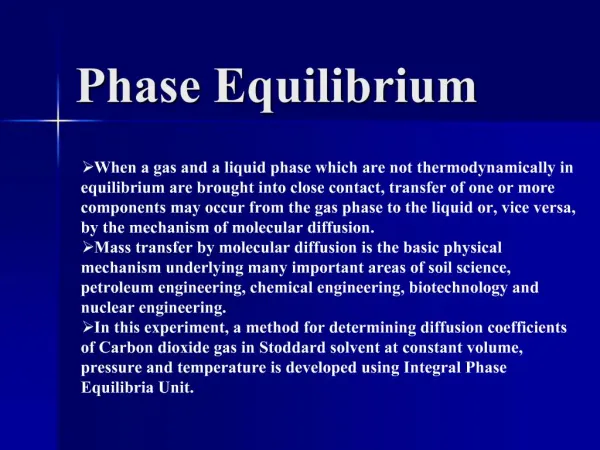
5.1 Introduction Phase The part whose physical and chemical properties are completely even is called phase. There is an obvious interface between two phases, the change of microcosmic properties in the interface is flight type. The total system phase is called phase number, we use to stand for it.
5.1 Introduction Gas No matter how many gases commix, there is only one gas phase. Solid Generally, one kind of solid has one phase. No matter how evenly two solid powder commix, they are still two phases.
5.2 Equilibrium conditions in heterogeneous system In a closed multi-phases system, there can be transition of heat, work and material. There are four equilibrium conditions. (1) thermo-equilibrium condition: suppose system has phases α, β,…… , F when it get equilibrium, every phases has the same temperature.
5.2 equilibrium conditions of heterogeneous system (2) pressure equilibrium condition: (3) Phase equilibrium condition: (4) chemical equilibrium condition:
5.3 Phase rule 5.3.1 Number of independent component Definition: In the equilibrium condition, the independent species number which can insure the composing of every phases is called the number of independent component.
5.3.2 Degree of freedom The number of independent intension variable which confirm the equilibrium system state is called degree of freedom, f. These intension variable usually called P, T, concentration and so on.
5.3.2 Degree of freedom If certain intension variable is fixed, the other intension variable except this variable is called condition freedom degree, f*. For example: P is fixed P and T are fixed,
5.3.3 Phase rule Phase rule shows the relationship of phase number , independent component number C and the free degree f.“2” indicate usually two variables T, P. Phase rule discovered by Gibbs earliest.
5.3.3 Phase rule If it affect by other force field besides T and P, then 2 is instead by n, that is: Phase diagram Phase diagram shows the multi-system state changes with the T, P, composing and other intension properties.
5.4 Phase diagram of single component 5.4.1 Some concepts Phase point The point which denote certain phase state (such as, composing, T, P, and so on).
5.4 Phase diagram of single component material system point The point in the phase diagram which denote the system total state is called material system point. In the single phase section, material system point and phase point are superposition; in the two phase sections, it has only material system point, its two corresponding phase composing is denoted by corresponding two phase points.
5.4.1 Some concepts Phase number and free degree of single component system When F=1 single phase f=2 double variable system F=2 bi-phases equilibrium f=1 single variable system F=3 tri-phase coexist f=0 no variable system.
5.4.2 phase diagram of water Three single phase section gas, liquid or solid, The certain independent change of T and P will not arouse phase change.
5.4.2.2 Three two phase equilibrium line F=2, f=1 P and T can only be changed one item, if the P is fixed, the T is decided by system.
5.4.2.3 Phase diagram OA a gas-liquid bi-phase equilibrium line OB a gas-solid line OC a liquid-solid line OD the AO prolong line Point Otriple point, three phase coexist, F=3, f=0
5.4.2.4 Phase changing process in the bi-equilibrium lines Any point in the two equilibrium line Can have three conditions. Such as point P in the line OA:
5.4.3 Triple point H2O: T=273.16K, p=610.62Pa When P=105 Pa, ice point temperature is 273.15K, change outside pressure, freezing point also changes following it.
5.4.4 Slope in bi-phase equilibrium line Slope of three bi-phase equilibrium line can work out by equation of Clausius-Clapeyron andClapeyron . Line OA slope is positive
5.4.4 Slope in bi-phase equilibrium line Line OB Slope is positive Line OC Slope is negative Example A
5.5 Phase diagram of two components P-x figure and T-x figure Bi-liquid-system of ideal complete solution Lever rule Distillation principle Bi-liquid-system of non-ideal complete solution Bi-liquid-system of part solution Bi-liquid-system of non-solution ----vapor distillation Simple low eutectic mixture System of forming compound complete soluble solid part soluble solid Zone melting
5.5.1 p-x figure and T-x figure For two components system, C=2, f=4-F , F is 1 at least, so f is 3 at most. These three variable usually is T, P and composing X. Therefore, if we need solid figure of three coordinate to express the diagram of bi-components system state.
5.5.2 Bi-liquid-system of ideal complete solution Two pure liquids can dissolve each other in various proportion, every composing follows Raoult Law. Bi-liquid-system of ideal complete solution. Such as benzene and toluene, hexane and heptane.
5.5.2 Bi-liquid-system of ideal complete solution (1) P-X figure P*A and P*B: Pure liquid saturation vapor pressure; P: total pressure.
5.5.2.2 p-x-y figure As we already know PA *, PB* , XA or XB , then we can work out the gas composing which corresponding every liquid phase, draw in the p-x figure, then we can get p-x-y figure.
5.5.2.3 p-x-y figure analysis If P*A >P*B , then, yA>xA , three areas: L; L+G; G
5.5.2.4 T-x figure • Boiling-point -composing figure. • For certain composing solution, the higher vapor pressure is, the lower the boiling point is. • T-x figure can be drawed by the experiment data directly and also worked out from the p-x figure.
5.5.2.5 From T-x to p-x figure • Benzene-toluene p-x figure at four different temp. • Draw a horizontal line at the pressure P$ location. • Mark the relationship of composing and boiling point. • the bigger P* is, the lower Tb is.
5.5.2.6 draw T-x figure • Use the methods of to work out the gas composing line. • gas line is above the liquid phase line
5.5.2.7 T-p-x diagram • Combine p-x and T-x together. • Right side of vertical plane, xA=1, xB=0 Then, PA* and TA*. • Left side, xA=0, xB=1, then PB* and TB*.
5.5.2.7.2 T-p-x diagram The shuttle pattern of concomitant gas-liquid bi-phase moves along two lines pA*-TA* and pB*-TB* , the flat Column space area is the gas-liquid bi-phase coexist area,
5.5.2.7.3 T-p-x diagram in the frontage above the coexist area, it is the high temperature, low pressure area, therefore, it is gas phase area; in the coexist area under behind, it is the low temperature, high pressure area, it is liquid phase area.
5.5.2.7.4 T-p-x diagram In the solid figure, all the verticals which parallel with the most front plane, then we Can get the T-x figure; All the section which parallel with the most above plane is isothermal plane, then we can get the p-x figure.
or 5.5.3 Lever rule • DE: isothermal tie line. • All of the material system points in DE are denoted by the composing of point D (Liquid) and E(Gas) • Material system point is thought as pivot. .
5.5.4 Distillation principle Simple distillation Simple distillation can only detach briefly A and B of the bi-liquid system.
5.5.4 Distillation principle In the T-x figure of A and B, the boiling-point of pure A is higher than pure B, it shows that the content of B composing in gas phase is higher when distilling, the content of A composing in liquid phase is higher too. Simply distilling once, the substance which has been distilled, composing B will increase obviously, composing A in residual liquid will increase too.
5.5.4.2 Simple distillation bi-phase solution X1 , boiling when heating to T1, the composing of balanceable gas phase is y1 (content B increase).
5.5.4.2 Simple distillation Condense the vapor which composing is y1, content B in the liquid phase, composing ascends along line OA, boiling-point also ascends to T2, at this moment, corresponding gas phase composing is y2. Incept the the substance which has been distilled between T1–T2, composing between y1–y2 , residual liquid is x2, content A increase. Thus, detach A and B briefly.
5.5.4.3 Fine distillation principle Fine distillation, rectification is the Combination of many steps of simple distillation. The bottom of rectify tower is heating area, temperature is the highest one; The temperature of the tower peak is the lowest one.
5.5.4.3.2 Fine distillation principle The rectification result, the collecting composing which condensed in the peak of the tower is the pure low boiling-point composing, the pure high boiling-point composing one left in the bottom of the tower. Rectification tower has many different kinds, as the figure shows, it is the sketch map of the rectification tower which is bubble covered tower state.
5.5.4.3.3 Fine distillation principle Use the T-x figure of A, B bi-composing to express the rectification process.
5.5.5 Bi-liquid-system of non-ideal complete solution 5.5.5.1 Positive deviation to Raoult law The broken line is theory value, real line is experiment value. Real vapor pressure is higher than calculated value.
5.5.5.1.2 P-x(y) & T-x(y) figure Draw the corresponding gas composing line, then we can get p-x(y) figure and T-x(y) figure. Liquid phase line is no longer beeline.
5.5.5.2 The peak in diagram The positive warp is so large, the highest point in the p-x figure is formed. The one has highest point in the p-x figure, also has lowest point in the T-x figure. The lowest point: minimum azeotropic point.
5.5.5.2.2 Minimum azeotropic mixture In the T-x(y) figure, the mixture lies in the lowest-boiling azeotrope is called minimum azeotropic mixture. It is mixture not compound, which composation in the fixed pressure has fixed value. But the coposation of lowest-boiling azeotrope chages with P, T change of pressure. The systems: H2O-C2H5OH; C2H5OH-C6H6
5.5.5.2.3 H2O-C2H5OH azeotrope Combination of two simple T-x(y) figure. H2O-C2H5OH is 351.28K, it contains ethanol 95.57. If the ethanol content < 95.57, absolute alcohol can not be get. The absorber CaCl2 , molecule siever can make the ethanol content excess 95.57.
5.5.5.3 Lowest point in p-x diagram The one has lowest point in the p-x figure, also has highest point in the T-x figure, the highest point is called maximum azeotropic point.