Download

1 / 32
320 likes | 677 Vues
The Economics of Nuclear Power. Steve Fetter University of Maryland. Cost of Electricity, U.S. Reactors (2004$/MWh). Average COE, 2005, all sources. 30 40 50 60 70 80 90 100 110 120 130 140 . Koomey & Hultman (submitted) 2007.

E N D
The Economics of Nuclear Power Steve Fetter University of Maryland
Cost of Electricity, U.S. Reactors (2004$/MWh) Average COE, 2005, all sources 30 40 50 60 70 80 90 100 110 120 130 140 Koomey & Hultman (submitted) 2007
Cost of Electricity, 99 U.S. Reactors (2004$/MWh) Koomey & Hultman (submitted to EP 2007) Koomey & Hultman (submitted) 2007
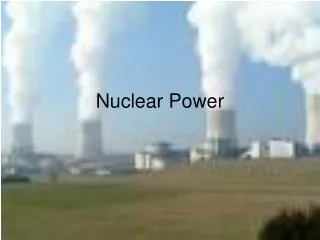
Nuclear Power Economics Estimated cost of electricity (COE) for a new U.S. nuclear reactor:
Nuclear Capital Cost • Construction costs in U.S. are highly uncertain • no operating reactors ordered after 1973 • last reactor was completed in 1996 • Reasonable estimate for the overnight construction cost of new advanced light-water reactors: about $2000/kWe • $2 billion for a 1000-MW reactor
Overnight Construction Costs (2004$/kW) Koomey & Hultman (submitted to EP 2007)
From OCC ($/kW) to COE ($/MWh) Fidc interest during construction factor (~0.2) Fpreop pre-operating cost factor (~0.1) Fcont contingency cost factor (~0.1) CF capacity factor (0.85) Fcr fixed charge rate Ftax property tax rate Fins insurance rate (~0.13/y)
Fixed Charge Rate Construction costs are financed through debt (bonds) and equity (stock). Electricity sales must be sufficient to pay dividends to investors, after taxes and other expenses are paid, which requires recovering a fraction of total up-front costs each year: “fixed charge rate” or Fcr. Fcr depends on the rate of return necessary to attract the required capital. For a regulated utility, the average cost of money is modest: 6 to 7%/y (half the rate for large private firms).
Fixed Charge Rate te corporate income tax rate (38%) b fraction of capital raised with bonds (0.5) ib rate of return on bonds (5%) ie rate of return on stocks (8%) N capital recovery/depreciation period (15 y)
Fuel Costs: Once-Through Fuel Cycle UF6 U3O8 LEU Conversion fresh fuel “front end” “back end” spentfuel Wet Storage Dry Storage (optional) Repository
Front-end Costs Assumes fuel with 4.4% U235 and burnup of 50 MWtd/kg, tails assay of 0.3% U235, and efficiency of 33%
From $/kg to $/MWh • Compare to total COE of $70/MWh • fuel related costs ~ 7% of COE • Conversion, enrichment, fabrication costs stable • At $50/kg, uranium 25% of fuel costs, 2% COE • average price paid by U.S. operators in 2006 • if price doubles, COE increases 2%
Direct Disposal v. Reprocessing in LWRs UF6 U3O8 LEU Conversion LEU fuel spent LEU spent LEU spent MOX spent MOX Interim Storage MOX fuel spent LEU Repository rU Pu HLW and ILW DU UF6 Conversion
Reprocessing and Recycle • Widespread agreement that today R&R is more expensive than direct disposal • official studies in France and Japan • recent studies by MIT, Harvard, Chicago • Advocates argue difference is small: additional 1.5 to 4 $/MWh (~3-8% of COE) • but total cost is high: $1-3 billion/yr, plus $50-100 billion to reprocess 60,000 tons already discharged • Advocates argue difference will disappear soon if nuclear power grows and U price increases • but premium is likely to persist for 50-100 yr even if nuclear grows substantially
Premium for R&R in LWRs $200/kg interim storage for DD $200/kg waste credit for R&R ($/MWh)
Breakeven Uranium Price $200/kg interim storage for DD $200/kg waste credit for R&R
These estimates are favorable to R&R • $200/kg interim-storage charge included for direct disposal (but not R&R) • $200/kg (50%) cost savings for waste disposal • MOX fuel fabrication well below recent prices • No charges for Pu storage, Am removal, reactor relicensing, or extra security for MOX • Equal disposal costs for spent MOX and LEU (or continuous recycle of without cost penalty)
LWR (direct disposal) v. FBR UF6 U3O8 LEU Conversion LEU fuel Interim Storage spent LEU Repository HLW, ILW MA rU Pu UF6 DU Conversion
Premium for R&R in FBRs Utility Owner $1000/kg reprocessing ($/MWh)
Uranium Resources • Breakeven U price > $130/kg even in best case • How much U is available? Red Book gives 16 Mt available at $130/kg, but… • high-cost resources in many countries (e.g., Australia) not estimated; • unconventional resources (e.g., phosphates) not included; • little investment in exploration in last 20 y • most minerals have steadily decreased in price with increasing consumption
A Very Rough Estimate of Ultimately Recoverable Uranium Resources • Red Book give 2.1 Mt at $40/kg • Hore-Lacy: “a doubling of price from present levels could be expected to create a tenfold increase in measured resources.” • So there should be 21 Mt available at $80/kg and 210 Mt at $160/kg • In general: R ~ 2.1(P/40)e where = long-term price elasticity of supply