Download
1 / 22
220 likes | 554 Vues
GLRC PBS Strategy Team Working Meeting Maumee Bay State Park, OH - February 22-23, 2005. Value of Mass Balance Modeling in Formulating a PTS Reduction Strategy for the Great Lakes. Joseph V. DePinto Limno-Tech, Inc. Ann Arbor, MI. Conceptual Approach to Assessing Chemicals of Concern.

E N D
GLRC PBS Strategy Team Working Meeting Maumee Bay State Park, OH - February 22-23, 2005 Value of Mass Balance Modeling in Formulating a PTS Reduction Strategy for the Great Lakes Joseph V. DePinto Limno-Tech, Inc. Ann Arbor, MI
Conceptual Approach to Assessing Chemicals of Concern Source Inputs Environmental Exposure Concentration Biota Tissue Residues Toxicity
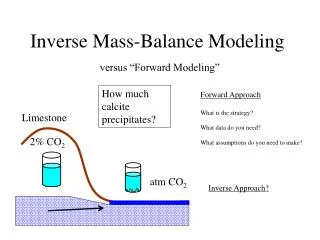
Mass Balance Model Concept Substance X External Loading System Boundary Control Volume Transport In Transport Out Transformations/ Reactions Rate of Change of [X] within System Boundary (dCX/dt) = (Loading) (Transport) (Transformations)
Mass Balance and Bioaccumulation Models developed to support toxics management • First models in early 1980s • First large lake feasibility study • (IJC “Battle of the Models” in Lake Ontario - 1987) • Green Bay Mass Balance Study (1988 – 1993) is first coordinated large lakes study • Concept expanded to full Lake Michigan via LMMB Study (1994 – 2004) • ARCS program used mass balance modeling for assessing remedial actions in Great Lakes AOCs • Lake Ontario Mass Balance Study (1997 – present) • Mackay and MacLeod bringing multi-media modeling to Great Lakes basin
Example Exposure Model Framework Flow Air-Water Exchange Runoff Loading Tributaries Water Plankton Upstream Loading Flow Upstream Flow Particle-bound chemical Dissolved chemical Partitioning Dispersion Diffusion Advection Settling Resuspension Benthos Dissolved chemical Particle-bound chemical Partitioning Chemical Decay or Biodegradation Mixed Layer (~5-10cm) Burial Porewater Flow Diffusion Buried Sediment Porewater Flow
Value of Models for PTS Policy and Management • Quantify relationship between loads and in situ concentrations • Rational basis for regulatory and remedial actions • Assist in design of more effective and efficient monitoring/surveillance programs • Documenting success of regulatory/remedial efforts • Models can provide a reference point for ecosystem health/integrity • Restoration goals, sustainable development • Models can aid a priori assessments • Relative risks of chemicals of emerging concern • Impact of exogenous stressors (e.g., zebra mussels, climate change • Provide a reference state for management programs • By forecasting system trend under no action • By explaining small scale, stochastic variability in monitoring data
LOTOX2 Chemical Mass Balance Framework Atmospheric wet & dry deposition Gas phase absorption Volatilization Niagara river Total toxicant in water column Outflow Hamilton Harbor desorption Toxicant on suspended particulates Toxicant in dissolved form US tributaries Water Column Canadian tributaries sorption Decay US direct sources diffusive exchange resuspension Canadian direct sources settling Total toxicant in sediment desorption Toxicant on sediment particulates Dissolved toxicant in interstitial water Decay Surficial Sediment sorption Deep Sediment burial
Toxicant Concentration in Phytoplankton (mg/g) (1) Toxicant Concentration in Zooplankton (mg/g) (2) Toxicant Concentration in Small Fish (mg/g) (3) Toxicant Concentration in Large Fish (mg/g) (4) Bioaccumulation Model Framework Predation Depuration Depuration Depuration Depuration Uptake Uptake Uptake Uptake “Available” (Dissolved) Chemical Water Concentration (ng/L) Physical-Chemical Model of Particulate and Dissolved Concentrations
Baseline and Categorical Scenarios(all scenarios start at 2000 and run for 50 years)
Annual Lakewide PCB Mass Balance for 1995: generated by LOTOX2 Year: 1995 Lake Ontario PCB Mass Balance (kg/yr) Atm Deposition Absorption Volatilization 49 112 655 Niagara River Outflow 263 47 Water Column Settling Watershed 538 Decay 134 0 Resuspension Diffusion 627 21 Burial Sediment 1,509 Delta Initial Mass Final Mass Water Column: 426 391 (35) Sediment: 38,124 36,505 (1,619)
Baseline and Categorical Scenarios(all scenarios start at 2000 and run for 50 years)
Process for Using MB Modeling to Evaluate Chemical Reduction Strategies • Estimate loading of contaminant of concern to the lake • Gather available concentration data in all media • Obtain physical-chemical property data for chemical of concern • Obtain lake-specific environmental/ limnological data • Run steady-state model to reconcile ambient data against loads • Run dynamic model to estimate time-variable response to recommended actions relative to targets
Using MB Modeling to Screen Chemicals of Emerging Concern Requires • A multi-media, basin-wide modeling framework • Assess exchange between air, land, and water media • Connect receptors to source emissions • Assess relative contributions from inside and outside the basin • Assess inter-lake transfer • Calibrate the multi-media model • Water, solids, and PCB balances • Chemical-specific data • Chemical properties (e.g., Koc, H) • Estimate or projection of chemical emissions from PS and NPS • Basin boundary conditions
Baseline and Categorical Scenarios(all scenarios start at 2000 and run for 50 years) • Baseline “No Action” scenario – constant load from all sources after 2000 • Ongoing recovery scenario – loads from all sources continue to decline at first-order rate based on previous 15 years • Point source elimination – zero all point sources with other loads held constant • Tributary source elimination – zero all tributary loads (including PS) while holding Niagara River and atmospheric sources constant • Niagara River elimination – zero load from Niagara River with all other sources held constant • Atmospheric load elimination – eliminate wet/dry deposition and zero atmospheric gas phase concentration with all other sources held constant
Baseline and Categorical Scenarios(all scenarios start at 2000 and run for 50 years) • Cumulative source category elimination scenario – sequentially zero PS, tributaries, Niagara River, and atmospheric deposition • Zero all point sources • Zero all PS + tributaries • Zero all PS + tributaries + Niagara River • Zero all PS + tributaries + Niagara River + atmospheric deposition/boundary condition (equivalent to scenario no. 8) • Eliminate all external loads and atmosphere boundary condition
LOTOX2 Findings for Management of PCBs in Lake Ontario • Significant load reductions from mid-60s through 80s have had major impact on open water and lake trout rapidly declining trends through that period. • Slower declines in open waters through ‘90s are largely result of sediment feedback as sediments respond much slower than water. • Lake is not yet at steady-state with current loads. Time to approximate steady-state with 2000 loads is ~30 years. • Ongoing load reductions after 2000 take 5-10 years before lake trout responses are distinguishable from no post-2000 load reductions.
LOTOX2 Findings for Management of PCBs in Lake Ontario (cont.) • At current levels, atmospheric gas phase PCBs will begin controlling lake trout concentrations when watershed loads decrease to approximately 200 Kg/y. • Point Sources of PCBs are relatively small fraction of current total loading; therefore, further PS reductions will provide small improvement in lakewide conditions. • At present model cannot address problems in localized areas (tributaries, bays, nearshore areas (AOCs)), where PS reductions will have greatest value.