Download
1 / 40
400 likes | 718 Vues
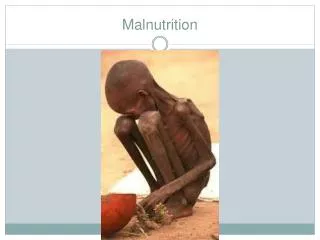
The Biology of Malnutrition. The cycle of malnutrition. How and where to break the cycle is the issue The focus of intervention is now on the Lifecycle or life course. Types of Malnutrition. Overnutrition Secondary malnutrition Micronutrient malnutrition Protein Calorie malnutrition.

E N D
The cycle of malnutrition • How and where to break the cycle is the issue • The focus of intervention is now on the Lifecycle or life course
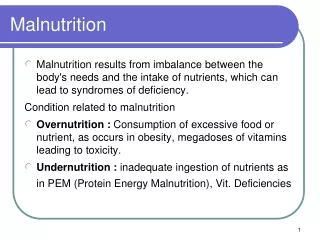
Types of Malnutrition • Overnutrition • Secondary malnutrition • Micronutrient malnutrition • Protein Calorie malnutrition
Overnutrition • Too many calories leading to obesity, diabetes, hypertension and cardiovascular disease • “Transition diets” now a consideration of WHO due to increase worldwide in chronic disease due to dietary change
Overnutrition • On a global basis 79 % of all deaths attributable to chronic disease are already occurring in developing countries • Public health implications are “staggering” • Overnutrition following fetal malnutrition has also been linked to chronic disease risk in adulthood
Secondary Malnutrition • Condition that prevents proper digestion or absorption • Often accompanies and exacerbates other types of malnutrition
Secondary Malnutrition- causative conditions • Loss of appetite • Alteration of normal metabolism • during infection/fever • HIV/AIDS • Prevention of nutrient absorption • Diarrheal infection causing changes in GI epithelium
Secondary Malnutrition- causative conditions • Diversion of nutrients to parasitic agents themselves • Hookworms, tapeworms, schistosome worm • Malaria
Prevention of nutrient diversion • Sanitary waste disposal and clean water important in reducing secondary malnutrition • Prevention of transmission of parasites and diarrheal diseases • Hookworm acquired by walking barefoot over contaminated soil • Other roundworm infections use oral-fecal route
Prevention of nutrient diversion • Soap an important factor in nutritional status • Education of women extremely important in this regard
Micronutrient Malnutrition • Dietary Deficiencies of • Vitamin A • Iodine • Iron • Others: Zinc, vitamins D, C, and Bs
Protein Calorie Malnutrition • More food needed for normal growth, health and activity • Rarely have protein deficiency without caloric deficiency due to the nature of the food supplies • exception seen with cassava and plantain as staples
Role of calories • Involuntary use: breathing, blood circulation, digestion, maintaining muscle tone and body temperature • Physical activity • Mental activity • Fighting disease • Growth
Role of protein • For building cells that make up muscles, membranes, cartilage and hair • Carrying oxygen • Nutrient transport • Antibodies • Enzymes needed for most chemical reactions in the body
What happens to people when they have inadequate amounts of food and nutrients? • Metabolic changes • Physiologic changes • Psychological changes
Metabolic Response to Starvation • Hunger subsides after 2-3 days • Defecation ceases after 3-4 days • Urine output drops after 1 week in the majority of people to 100-700 ml/day • Blood glucose levels drop to 35 to 65 mg/dl without clinical signs of hypoglycemia • Nausea occurs in about 1/3 from ketone production from body fat breakdown
Metabolic Response to Starvation • Serum electrolytes do not change • Renal conservation occurs promptly • Rarely see low potassium in prolonged fast
Metabolic Response to Starvation • Negative nitrogen balance - 1st 5 to 7 days • 12 to 15 grams of nitrogen per day is excreted in the urine (based on 1800 kcal daily needs) • Skeletal muscle is catabolized to produce glucose (gluconeogenesis), using about 75 grams per day of protein • This is equal to ¾ lb of wet tissue per day • About 160 gm per day of body fat is also used
Metabolic Response to Starvation • Negative nitrogen balance • Gradually slows so that at about 1 month • 2-4 grams of nitrogen is loss per day • Skeletal muscle catabolism decrease significantly • Only for cells that have to have glucose • Central nervous system • Red blood cells • White blood cells
Metabolic Response to Starvation • Gradual shift in metabolic fuels • First glucose is produced from protein breakdown to provide energy • Then fat breakdown and metabolism provides ketones for all tissues except CNS, RBC and WBC • Brain will eventually use ketones but red blood cells have no mitochondria, so must use glucose • Serum fatty acid levels increase • Serum albumin is normal until late in starvation
Metabolic Response to Starvation • Hormonal changes • Plasma insulin decreases • Plasma cortisol and growth hormone stay the same and glucagon increases • These changes are responsible for the mobilization and oxidation of fat stores • Changes in sympathetic nervous system and metabolism of thyroid hormone lowers basal metabolic rate
Metabolic Response to Starvation • Weight loss • First week 0.7 to 1.3 kg per day, much of which is slat and water loss • After the first week 0.3 to0.5 kg/day • Basal Metabolic Rate and Total Energy Expenditure decrease in prolonged starvation • See decreased activity, increased sleep • Decrease in body temperature
Classic study by Keyes described physical and psychological changes during a period of semi-starvation. • Traditionally used to describe what happens during dieting • Perhaps should think about traditional stereotypes of the poor in relationship to the findings of this study
Keyes Study • Impetus: realization WWII would be over soon and food relief was going to be necessary – needed data • Subjects: • 32 men • Conscientious objectors • Ages 25.5 +/-3.5 years • Time period: • 11/19/44 to 1/20/45
Keyes Study -Diet • 12 weeks of baseline diet ad lib • Normal diet of 51% carbohydrate, 13% protein, 32% fat • 24 week semi-starvation diet • 12 weeks of rehabilitation (normal diet)
Keyes Study • 24 week semi-starvation diet • Consisted of food designed to represent the types of foods available in European famine areas – whole wheat bread, potatoes, cereals, considerable amounts of turnips and cabbage, token amounts of meat and dairy products • About 1600 kcal per day, 71% carbohydrate, 12% protein and 17% fat • Served in 2 meals per day at 8:30AM and 5 PM
Keyes Study - Activity • Assigned specific tasks such as general maintenance, laboratory assistance, shop duties and desk work about 15 hours per week • Educational programs, about 25 hours per week • Walked 35 km out-of-doors per week and were on a treadmill for ½ hour
Keyes Study – Body changes • Body weight decreased about 25% • From mean of 69.4kg (BMI 21.4) to 52.6 kg (BMI 16.3) • Weight loss decreased progressively and nearly reached a plateau at the end of the semi-starvation period • Subjects adjusted their energy expenditure to reach a balance after 24 weeks at 45% of the ad lib diet
Keyes Study - Adaptations • Adaptation accompanied by a loss of active tissue • Relatively high loss of lean body mass • Body fat loss made up about 1/3 of the weight change
Keyes Study - Adaptations • Reduced activity costs were the main part of the energy savings • Decrease BMR due to less lean body mass • Less thermic effect of food due to lower intake • Reduced body weight resulting in less caloric cost of physical activity
Keyes Study - Adaptations • “Real” adaptation • Reduction in tissue metabolism • Decreased BMR • Reduction in physical activity
Keyes Study – Physical signs • After about 3 months, participants complained of • Fatigue • Muscle soreness • Irritability • Hunger pains
Keyes Study – Physical signs • After 3 months, participants • Exhibited a lack of • Ambition • Self-discipline • Poor concentration • Were often moody and depressed • Became less able to laugh heartily, sneeze and tolerate heat • Heart rate and muscle tone decreased
Keyes Study - recovery • When permitted to eat normally again, the desire for more food and a feeling of fatigue continued, even after 12 weeks of rehabilitation. • Full recovery required 33 weeks.
Study Questions • What are the implications of this research to population groups with cyclical food availability? • What might happen to the capacity to work with undernutrition?