1 / 26
250 likes | 275 Vues
This presentation is based on Entity Relationship Diagram in DBMS, you will understand the use of Entity Relationship Diagram and learn about its components. The tutorial will include how to draw an ER Diagram.<br><br>Eligibility:<br>This online SQL certification course is ideal for freshers, programmers, software developers, and testing professionals who want to learn SQL. Itu2019s also ideal for marketing professionals and salespeople who want to better understand their companyu2019s data.<br><br>Learn more: https://www.simplilearn.com/sql-database-training-course

E N D
What’s in it for you? • What is an Entity Relationship Diagram? • Why use ER diagram? • Symbols used in ER Diagram • Components of ER Diagram • Entity • Attribute • Types of Attribute • Relationship • Types of Relationship • How to draw an ER Diagram?
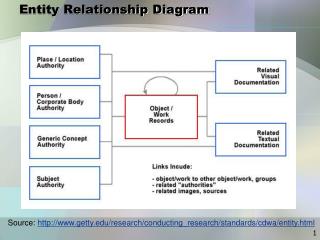
What is an Entity Relationship Diagram? • An Entity-relationship Diagram (ER Diagram) describes the relationship of entities that need to be stored in a database • ER Diagram is mainly a structural design for the database. It is a framework using specialized symbols to define the relationship between entities • ER diagram is created based on three main components entities, attributes, and relationships
What is an Entity Relationship Diagram? Attributes Stu_Name Cou_Name Cou_Id Stu_Id Stu_Age study Course Student Entities
Why use Entity Relationship Diagram? • Helps us conceptualize the database and help us know which fields need to be embedded for a particular entity • ER Diagram gives a better understanding of the information to be stored in a database • Reduces complexity and saves time which allows you to build databases quickly • Helps to describe elements using Entity Relationship model
Symbols used in ER Diagram Attribute Entity Weak Entity Derived Attribute Multivalued Attribute Relationship
Components of ER Diagram Entity Attribute Relationship 1 2 3 • Key • Composite • Multivalued • Derived • One to One • One to Many • Many to One • Many to Many • Weak Entity
Entity • An entity can be either living or non-living component • An entity is showcased as a rectangle in an ER diagram • For Example, Student study course, here both student and course are entities Course study Student Entity
Weak Entity • An entity that relies over another entity is called weak entity • The weak entity is showcased as a double rectangle in ER Diagram School Number Room Number School Classroom Relation
Attribute • An attribute describes the property of an entity • An attribute is represented as Oval in an ER diagram Address RollNo Student Name Age
Key Attribute • Key attribute uniquely identifies an entity from an entity set • The text of key attribute is underlined • For example, student RollNo can uniquely identify a student from a set of students Address RollNo Student Age Name
Composite Attribute • An attribute that is composed of other attributes is known as a composite attribute • The composite attribute is represented with an oval, and that attribute is further connected with other ovals Name First_Name Middle_Name Last_Name
Multivalued Attribute • An attribute that can possess more than one value, such attributes are called multivalued attributes • The double oval is used to represent a multivalued attribute Phone_no RollNo Student Age Name
Derived Attribute • An attribute that can be extracted from other attributes of the entity is known as derived attribute • In ER diagram, derived attribute is represented by dashed oval Address Date of Birth Student Age Name
Relationship • A relationship is showcased by diamond shape in ER diagram • It shows the relationship among entities Course study Student Relationship
One to One Relationship • When a single element of an entity is associated with a single element of another entity that is called one to one relationship • For example, a student has only one Identification card and an Identification card is given to one person 1 1 Identification Card has Student
One to Many Relationship • When a single element of an entity is associated with more than one element of another entity that is called one to many relationship • For example, a customer can place many orders, but an order cannot be placed by many customers M 1 Order placed Customer
Many to One Relationship • When more than one element of an entity is related with a single element of another entity then it is called many to one relationship • For example, Student enrolls for only one course, but a course can have many students 1 M Course enroll Student
Many to Many Relationship • When more than one element of an entity is associated with more than one element of another entity that is called many to many relationship • For example, Employee can be assigned to many projects and project can have many employees M M Project is assigned Employee
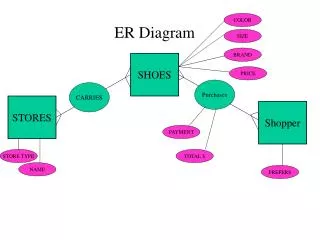
How to Draw an ER Diagram? • First, identify all the Entities. Embed all the entities in a rectangle and label them properly • Identify relationships between entities and connect them using a diamond in the middle illustrating the relationship. Do not connect relationships to each other • Connect attributes for entities and label them properly • Eradicate any redundant entities or relationships • Make sure your ER Diagram supports all the data provided to design the database • Make effective use of colors to highlight key areas in your diagrams
Join us to learn more! simplilearn.com UNITED STATES Simplilearn Solutions Pvt. Limited 201 Spear Street, Suite 1100 San Francisco, CA 94105 Phone: (415) 741-3319 INDIA Simplilearn Solutions Pvt. Limited #53/1C, 24th Main, 2nd Sector HSR Layout, Bangalore 560102 Phone: +91 8069999471 UNITED STATES Simplilearn Solutions Pvt. Limited 801 Corporate Center Drive, Suite 138 Raleigh, NC 27607 Phone: (919) 205-5565