Mathematics For Machine Learning | Essential Mathematics - Machine Learning Tutorial | Simplilearn
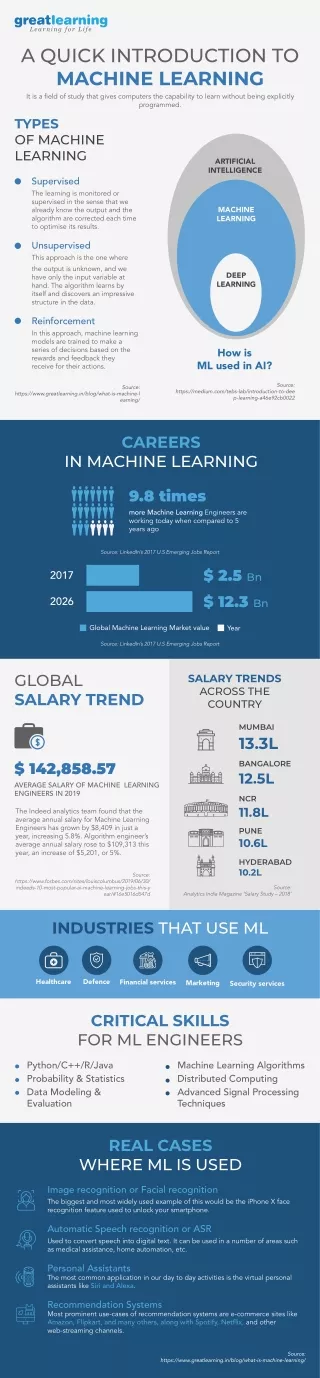
Mathematics forms the core of Machine Learning and is one of the prerequisites. This presentation on Mathematics for Machine Learning will help you understand linear algebra, vectors, and matrices. Then, you will learn about integral calculus, followed by different topics in Statistics for machine learning. Finally, we'll look at Probability for Machine Learning. All these topics contain hands-on demo in Python. So, let's get started with Mathematics for Machine Learning.<br><br>Data and its types<br>Linear algebra and its concepts<br>Calculus<br>Statistics for machine learning<br>Probability for machine learning<br><br>About Simplilearn Machine Learning course:<br>A form of artificial intelligence, Machine Learning is revolutionizing the world of computing as well as all peopleu2019s digital interactions. Machine Learning powers such innovative automated technologies as recommendation engines, facial recognition, fraud protection and even self-driving cars.This Machine Learning course prepares engineers, data scientists and other professionals with knowledge and hands-on skills required for certification and job competency in Machine Learning.<br><br>What skills will you learn from this Machine Learning course?<br><br>By the end of this Machine Learning course, you will be able to:<br>1. Master the concepts of supervised, unsupervised and reinforcement learning concepts and modeling.<br>2. Gain practical mastery over principles, algorithms, and applications of Machine Learning through a hands-on approach which includes working on 28 projects and one capstone project.<br>3. Acquire thorough knowledge of the mathematical and heuristic aspects of Machine Learning.<br>4. Understand the concepts and operation of support vector machines, kernel SVM, naive Bayes, decision tree classifier, random forest classifier, logistic regression, K-nearest neighbors, K-means clustering and more.<br>5. Be able to model a wide variety of robust Machine Learning algorithms including deep learning, clustering, and recommendation systems<br><br>ud83dudc49Learn more at: https://bit.ly/3fouyY0<br>

Mathematics For Machine Learning | Essential Mathematics - Machine Learning Tutorial | Simplilearn
E N D
Presentation Transcript
Agenda Data and its types linear algebra and its concepts Statistics for machine learning Probability for machine learning Hands on code demos
Agenda Data and its types Linear algebra and its concepts Calculus Statistics for machine learning Probability for machine learning Hands on demos
Agenda Data and its types linear algebra and its concepts Statistics for machine learning Probability for machine learning Click here to watch the video Hands on code demos
What is Data? Datadenotes the individual pieces of factual information collected from various sources. It is stored, processed and later used for analysis SMS Performing analytics to derive insights Data in various forms
Types of data Data Qualitative/ Categorical Quantitative/ Numerical Discrete Nominal Ordinal Continuous
Qualitative/ Categorical Data Nominal They are used to label variables without providing any measurable value Ordinal Categorical data with a set order or scale to it E.g.: Country, gender, race, hair color, etc. E.g.: Salary range, movie ratings etc.
Quantitative/ Numerical Data Discrete Data with final set of values which can be categorized Continuous Continuous data can take any numeric value within a range E.g.: Class strength, questions answered correctly, and runs hit in cricket E.g.: Water pressure, weight of a person etc.
Linear Algebra Linear algebra is the domain of mathematics concerning linear equations and their representations in vector spaces and through matrices Linear Equations Vectors Matrix Operation A + B = C 2x + 4y – 3z = 10 4.0x + 12.4y = z -19x + 30y + 6z = 40 a = b0 + b1x1 + b2x2 C B A
Linear Equations An equation having a maximum order of one is called a Linear Equation Y axis Standard form of Linear Equation Ax + B= C One variable Ax + By= C Two variables Ax + By= C X axis Three variables Ax + By + Cz = D N variables Ax + By+ Cz +….= N
Linear Equations In slope-intercept form, a linear equation can be represented as Value of Y when x=0 y= mx+c Slope/Gradient of the line y= 2x+3
Linear Equations In slope-intercept form, a linear equation can be represented as Value of Y when x=0 y= 2x+3 y= mx+c Slope/Gradient of the line y= 2x+3 Value of Y when x=0 Slope/Gradient of the line
Matrices A matrix refers to a rectangular representation of an array of numbers arranged in columns and rows M rows x N columns A11 A12 A13 . . . . . . . AN A21 A31 . . . AM Here A11 is the denotes the element of first row in first column Similarly, A12 is the element of first row and second columns and so on . . . . . . . . . . . . . . . . . . . . . . . . . . . . . . . . . . . . . . . . . . . . . . . . . . . . AMN
Matrix Operations Subtraction • Addition 3 5 5 16 3 5 5 16 - + 8 2 8 11 12 8 14 21
Matrix Operations • Multiplication 3 5 1 4 6 3 x 1x2 + 4x3 1x3 + 4x5 6x2 +3x3 6x3 + 3x5 14 23 21 33 = =
Matrix Operations • Transpose • Inverse Changing the signs of values across its main diagonal Flipping the matrix over its diagonal = = A A -22 8 14 -12 12 8 14 21 12 8 14 22 12 14 8 21 = = A-1 AT
Vectors In mathematics, one dimensional matrix is called a vector Arrow head tells the direction 1 2 3 4 Vector 1 2 3 4 Row Vector Column Vector Length tells the scalar value
Eigen Vectors and Eigen Values Eigen Vectors Vectors before transition The vectors that don’t change their span while transformation Eigen Values The scalar values that are associated to the vectors
Eigen Vectors and Eigen Values Eigen Vectors Vector after linear transition The vectors that don’t change their span while transformation Eigen Values The scalar values that are associated to the vectors is eigen vector 2 is eigen value
Eigen Vectors and Eigen Values Eigen Vectors Vector after linear transition The vectors that don’t change their span while transformation Eigen Values The scalar values that are associated to the vectors is eigen vector 3 is eigen value
Calculus Differentiation • Helps to calculate the spontaneous rate of change • Suppose we plot a graph of the speed of a car with respect to time Speed • The rate of change of speed with respect of time is nothing but acceleration x • The acceleration is the area between the start point x and end point delta x Time
Calculus Differentiation • Distance between x and x has to be smallest possible (near to zero) in order to approximate the acceleration Speed x Time
Calculus Integration • Finding the area under the slope is the main process in the integration • Similar, small intervals are made of smallest possible length x + x Speed • Helps to find the overall acceleration by summing up all the lengths together Time
Multivariate Calculus Multivariate calculus deals with functions that have multiple variables Multivariate Differentiation using Chain Rule : Multivariate Integration using Double Integral:
Applications of Calculus • It provides us the tools to build an accurate predictive model • Multivariate calculus explains the change in our target variable in relation to the rate of change in the input variables • In gradient descent, calculus is used to find the local and global maxima
APR APR I I L L Demo on Gradient Descent
Statistics Statistics concerns with the collection, organization, analysis, interpretation, and presentation of data
Important Terminologies • All objects or measurements whose properties are being observed Population OPTION 01 A metric that is used to represent a population characteristic OPTION 01 Parameter OPTION 01 A subset of the population studied OPTION 01 Sample OPTION 01 • A metric of interest for each person or object in a population Variable
Types of Sampling Non-probabilistic approach Probabilistic approach Selecting samples based on the subjective judgment of the researcher rather than random selection E.g. Convenience, Quota, Snowball Selecting samples from a larger population using a method based on the theory of probability E.g. Random, Systematic, Stratified
Probabilistic Sampling Random Systematic Stratified Sampling Sampling Sampling A D B Selecting random sized samples from each group or category Selecting approx. equal sized samples from each group or category Selecting random sized samples from each group or category with a fixed, periodic interval C
Probabilistic Sampling Random Systematic Stratified Sampling Sampling Sampling A D B E.g.: Selecting 25 employees from a company of 250 employees randomly E.g.: Selecting 1 employee from every branch in the company office E.g.: Selecting 1 employee from every 50 unique employees in a company of 250 employees C
Types of Statistics Statistics Descriptive Inferential
Descriptive Statistics It is used to describe the basic features of data and form the basis of quantitative analysis of data Measure of Spread • Range • Interquartile range • Variance • Standard deviation • Mean • Median • Mode Measure of central tendencies
Measure of Central Tendencies • Mean : It is the average of the set of values considered • Median : Median separates the higher half and the lower half of data • Mode : it is the most frequently appearing value
Measure of Central Tendencies Mean: Average marks of students in a classroom Mean Total no. of students Median: 0 1 2 3 4 5 6 7 8 9 10 Mode:What mark was scored by most of the students in a test
Measure of Spread • Range : Difference between the highest and the lowest value • Interquartile range : Quartiles divide a rank-ordered data set into four equal parts • Variance : measures how far each number in the set is from the mean and therefore from every other number in the set • Standard deviation : it is the measure of the variation or dispersion of a set of values from the mean
Measure of Spread Range: Maximum marks – Minimum marks = 90 - 45 = 45
Measure of Spread Interquartile range: 45 50 56 63 71 85 90 Q1 Q3 Median Q2
Measure of Spread Mean = 45 + 50 + 56 + 63 + 71 + 85 + 90 = 65.71 = 66 (approx.) To understand the Variance and Standard Deviation we first need to find out mean 7
Measure of Spread Variance = (Marks - Mean)2 Total observations = 256 + 441 + 361 + 576 + 100 + 25 + 9 7 = 253 (approx.) Standard Deviation = Variance = 16 (approx.)
APR APR I I L L Demo on Statistics
Inferential Statistics Inferential statistics allows you to make predictions or inferences from data 50-60% Movie Ratings
Point Estimation It is a process of finding an approximate value for a population's parameter, like mean, from random samples of the population Let’s take an example of testing vaccines for COVID-19 Select a group • A group of people are chosen from the population Medical Trial • Medical trials are performed • Results are generalized for the whole population Results work for population
Applications of Inferential Statistics • Hypothesis Testing 1 • Central limit theorem 5 2 Confidence Interval 4 • Normal distribution 3 Binomial theorem
Hypothesis Testing Hypothesis testing is used to measure the plausibility of a hypothesis (assumption) by using sample data Steps involved in hypothesis testing: Execute the test Formulate hypothesis Figure out the right test Make a decision
Use Case Let’s consider an example: Four students were given a task to clean a room everyday. They decided to distribute the job of cleaning the room among themselves. They did so by making 4 chits which has their names on it and the name that gets picked up has to do the cleaning for that day Nick Rob Emilia Summer Rob took the opportunity to make chits and wrote everyone’s name on it