1 / 19
190 likes | 341 Vues
This presemtation will help you learn the significant differences between the two most popular business intelligence tools, namely Power BI and Tableau. First, we will look at the history of Power BI and Tableau, followed by their cost. Then we'll see which of them has better performance and a good user interface. Next, you will get an understanding of the programming languages that they support and their data visualization capabilities. You will then get an idea of how Power BI and Tableau support machine learning and which of them has better customer support. Finally, I'll tell you how Simplilearn can help you start your career in Power BI and Tableau. So, let's get started.<br>About Power BI Certification Training Course:<br>Learn data visualization and all of the critical features in Power BI in this Power BI Certification course, which allows you to explore, experiment, fix, prepare, and present data quickly and easily.<br><br>This Power BI Training course will help you get the most out of Power BI, enabling you to solve business problems and improve operations. The course helps you master the development of dashboards from published reports, discover better insight from your data, and create practical recipes on the various tasks that you can do with Microsoft Power BI.<br><br>Key Features:<br>- 6 hours of enriched learning<br>- Lifetime access to self-paced learning<br>- Industry recognized course completion certificate<br><br>Eligibility:<br>The Power BI certification training course is suitable for people who have never worked with Power BI but want to want to understand how to use the Power BI tools. This Power BI training course is also applicable for people who want to understand how to create customized visuals with the Power BI developer tools.<br><br>Learn more at https://www.simplilearn.com/power-bi-certification-training-course

E N D
What’s in it for you? Compare Power BI and Tableau based on the following categories: 6. Ease of Use 7. Programming support 8. Data Visualization 9. Machine Learning 10. Customer Support History Cost Performance User Interface Data Sources
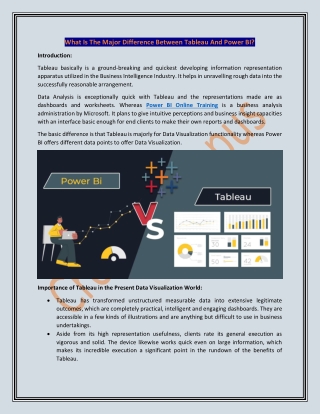
History Tableau is a Data VisualizationSoftware used for Data Science and business intelligence. It can create a wide range of different visualization Power BI is a Self-Service Business Analytics tool developed by Microsoft with the capability to analyse and visualize data, extract insights
History Tableau software was founded in 2003 in Mountain View, California. Tableau Desktop 1.0 was released in 2004 Power BI was designed by Ron George in the summer of 2010. It was initially available for public download on July 11, 2011 2004 2011
Cost The pro version of Tableau comes at more than $35 per month per user. The yearly subscription costs around $1000 Power BI professional version costs less than $10 per month per user. The yearly subscription comes around $100
Performance Tableau can handle large volumes of data easily. It is faster and provides extensive features for visualizing the data Power BI is faster and performs better when the volume of data is limited. Power BI tends to drag slow while handling bulk data
User Interface Tableau has an intelligent interface that enables you to create and customize the dashboards according to your requirements easily Power BI interface is easy to learn and understand. It is intuitive and user friendly that allows you to operate better
Data Sources Tableau software has access to numerous data sources and servers such as Excel, Text File, PDF, JSON, Amazon Redshift, Cloudera Hadoop, Google Analytics, etc. Power BI supports various data sources but has limited access to other databases and servers compared to Tableau. Example: SQL Server, Access DB, Oracle Database, IBM DB2, MySQL, etc.
Ease of Use Tableau provides some significant advantages for exploring data in detail. Tableau is also coming up with natural language capabilities Power BI has a slight edge with ease of use because it is based on a user interface that is based on Microsoft Office 365
Programming Support Tableau integrates much better with R language compared to Power BI. Tableau SDK can be implemented using any of four languages from C, C++, Java and Python Power BI supports DAX, and M language. It can connect to R programming language using Microsoft revolution analytics
Data Visualization Tableau delivers interactive visuals that support insights on the fly. It can translate queries to visualizations and makes you to ask questions, spot trends and identify opportunities Power BI has easy drag and drop functionality, with features that make data visually appealing. It offers a wide range of detailed and attractive visualizations to create reports and dashboards
Machine Learning Tableau supports the features of Python machine learning. This enables it to perform machine learning over the dataset Power BI is integrated with Microsoft Azure. It helps to understand the data and analyse the trends and patterns in the data
Customer Support Tableau has over 160,000 active users participating in over 500 global user groups and over 150,000 active customers participating in the Tableau online community Microsoft Power BI is relatively younger than Tableau and hence has a smaller community
Join us to learn more! simplilearn.com UNITED STATES Simplilearn Solutions Pvt. Limited 201 Spear Street, Suite 1100 San Francisco, CA 94105 Phone: (415) 741-3319 INDIA Simplilearn Solutions Pvt. Limited #53/1C, 24th Main, 2nd Sector HSR Layout, Bangalore 560102 Phone: +91 8069999471 UNITED STATES Simplilearn Solutions Pvt. Limited 801 Corporate Center Drive, Suite 138 Raleigh, NC 27607 Phone: (919) 205-5565