Download
1 / 16
160 likes | 189 Vues
My whole career I have been working with business intelligence (BI), and data visualization softwareu2019s within multiple organization. I have also used the latest versions of both Tableau and Power BI in real life projects. Today

E N D
TABLEAU VS POWER BI COMPARISON: My whole career I have been working with business intelligence (BI), and data visualization software’s within multiple organization. I have also used the latest versions of both Tableau and Power BI in real life projects. Today I am writing a comparison between my two favorite data visualization tools, Tableau and Microsoft Power BI. I will try to share what I saw using both data visualization tools as well as what other experts say about these tools. We will cover the advantages and disadvantages of both software’s which will hopefully help you answer any questions you have between the two.
FREE DOWNLOAD:Don't leave empty handed, download theTop 10 Dashboard Tips PDFto take with you. Get all 10 tips in a 1 page PDF!
DATA VISUALIZATION: Today’s world is full of data. In every second 37 TB data is being created. Data visualization should be an essential part of any business strategy. The process of collecting data and transforming data into a meaningful visualization will reduce cost and help teams make accurate business decisions. Visualization gives you answers to questions you didn’t know you had. – Ben Schneiderman
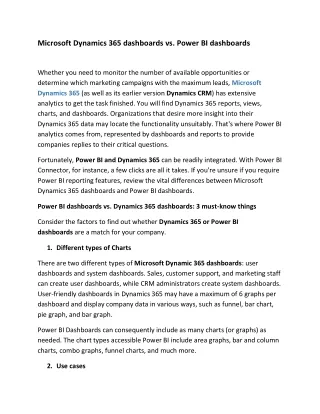
Figure:Power BI and Tableau visualization In my opinion, Tableau is the winner (might be biased), but Power BI is getting close. Tableau has been conducting research over a decade around data visualization, that is what they specialize in compare to Microsoft has there hands in everything. I feel Tableau is a more intuitive and flexible software when designing dashboards compared to Power BI. What I like most is I can get an immediate answer from my data in minutes using Tableau. This is possible because of the easy to understand click and drag interface within Tableau. Even my younger brother made some decent visualizations with some complex data without coding knowledge. Now don’t get me wrong, Tableau can be very complicated at times but overall if you have some decently clean data it is pretty easy to build something if it’s your first time. In the case of Power BI, it seems to be made with a more programmer approach. Things are not as easy to understand especially the calculations. The layout is also not as intuitive to me, but maybe that is just because I learned Tableau first. Another cool thing that just came out is in Tableau you can ask questions which is missing in Power BI. With that being said, I feel like Tableau development team is incredible. They are always coming up with new features and doing it quickly!
TABLEAU AND POWER BI DATA SOURCES: Both Tableau and Power BI allows us to connect to data directly from various sources. Tableau supports much more native data connections than Power BI at the moment. Here is a complete list of data connections for both software. Power BI Tableau Desktop Local Files Excel (*.xls, *.xlsx) Microsoft Access file Cube file Excel (*.xls, *.xlsx) Microsoft Access file (*.mdb,*.accdb) Cube file Text file (*.txt, *.csv, *.xml) JSON Folder Power BI Files Text file (*.txt, *.csv, *.tab, *.tsv) JSON, Statistical file (SAS,SPSS,R) Other (Tableau Data Extract files, Tableau workbooks)
DEPLOYMENT: Power BI has a SAAS model for deployment on the other hand Tableau has both on-premises and cloud options. On-premise is only for Power BI premium users. I have seen many business intelligence projects not using Power BI because of this as they need a more customizable solution and data security. PRODUCT PRICE:
Note: • Though you can work with Power BI Desktop free version, you will need Power BI Pro license to distribute your work to others, publishing content to Power BI Premium or Power BI Report Server and doing a collaboration with others. • All invoices need to be paid annually for both Power BI and Tableau. • Based on thedeployment option, Tableau explorer and Tableau Viewer price differ. If you have a small budget and you work with small data, then power BI is the best option based on price. But as your business grows and you have to analyze huge data then I will recommend using Tableau as a product license cost is not the only factor of total cost. In a recent survey about the total cost of ownership done by International Institute of IT Economics shows us that Tableau is cheaper than Power BI in the long run.
This chart is taken from the survey, and it shows a comparison between Tableau and Power BI. From this chart, we can see although Tableau license cost is higher than Power BI, in 3 years the total cost of ownership is 29% lower in Tableau. If you want to see how this survey is done and what methods was useddive into the reporthere.
CUSTOMER SUPPORT: There is not much difference between them. By phone and email, people can get direct support. Also, they can go to acustomer portaland get support via a support ticket. All users of Power BI can get support from the support ticket system, but premium and pro members get a faster response. COMMUNITY MATTERS: Tableau has a larger active community than Power BI. Strong growing communities indicates how many peoples are using their BI tool and how popular this software is getting day by day. 150,000 passionate users are in theTableau community forumand ready to welcome new people. People can get answers to their Tableau problems, connect with other users online or at Tableau user groups. Another cool thing is you will get access toTableau Zen Masterswho gives awesome tutorials and tips to create a masterpiece like them in their blogs, videos, and seminars. Tableau selects them every year from the experts who work to make Tableau easier for everyone. Though Power BI started its journey late, Tableaucommunityis growing at a ridiculous rate.
REPORT BY GARTNER: In Gartner Magic Quadrant for business intelligence and analytics platforms, 2018 both Tableau and Power BI have been recognized as a Leader.
Gartneris an IT consulting firm which providesMagic Quadrant(the culmination of research in a specific market) every year. This research evaluates the progress and positions of companies in a specific, technology-based market. According to Gartner, Tableau is the most attractive and intuitive visualization tool. Tableau leads in the ability to execute, but Power BI leads in the completeness of vision. REPORT BY IT CENTRAL STATION: IT central station provides a report based on their community. They verify the reviewer (are they real user) using their verification methods. They have ranked Tableau as the number 1 software for BI. They update thereportevery month. This picture is taken from the report (2019 January) done by It central station.
This article is not written to make your decision in buying software rather giving you the introduction of both front runners that are leading the business intelligence industry. As you can see both software’s are great for data analysis and has some differences. Both software’s keep innovating and adding new features so you can’t lose with either one. But Tableau still my favorite. Article Resource - https://vizualintelligenceconsulting.com/blog-tableau-vs-power-bi/