Download
1 / 22
240 likes | 1.38k Vues
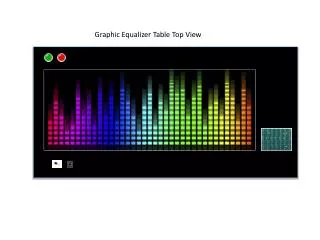
LCD Music Display and Graphic Equalizer. Adam Krzesinski and Cristina Vasco. Introduction. Purpose Graphical display of frequency components present in audio signal Visual representation of audio levels to aid in setting EQ parameters Real time equalization of audio signal

E N D
LCD Music Display and Graphic Equalizer Adam Krzesinski andCristina Vasco
Introduction • Purpose • Graphical display of frequency components present in audio signal • Visual representation of audio levels to aid in setting EQ parameters • Real time equalization of audio signal • EQ frequency bands correspond to displayed bands
Features – LCD Display • HD44780 display controller • 4 channels monitored • Amplitude resolution - 16 levels • Highly responsive with imperceptible delay (< 30ms)
Features – Equalizer • Four modification bands that correlate to display • FFT Convolution method equivalent to 500-tap FIR filter • User input through faders
Filterbank – Original Design • 8 hardware oscillator filters – LCR filter design • Output reflects energy of input signal in different frequency ranges • Constant Q over 8 octaves • 1 lowpass, 1 highpass, 6 bandpass
Filterbank - Problems • Impractical L and C values for low-frequency filters eg. 4.4mH • Large component values would produce unresponsive display • Large physical size of inductors and capacitors leading to expensive or inaccurate component values • 4.4mH => 878 turns with largest AL available (core T68-2)
Filterbank – DSP Implementation • Reduced to 4 bands • Operates on averaging FFT energy in each band • Each channel corresponds to trace of FFT in one of four frequency ranges • PIC interprets instantaneous DC values for display as magnitude of bar
Filterbank – DSP Implementation • Response of 4 filters to log chirp stimulus
Filterbank – DSP Implementation • Frequency bands chosen to cover equal space in log-frequency • Each band should also cover ranges with similar human hearing sensitivity
Filterbank – DSP Implementation • FFT energy ≠ loudness • Capture above shows most energy is focused in low frequencies • Display should parallel perceptual loudness of each frequency band • Solution – amplify higher bands before display
DSP Equalizer – FFT Convolution • Manipulation of FFT samples – frequency domain • Equivalent to convolution – time domain operation • Speed advantage when implementing higher-order filters ( > 60 taps) • Algorithm explanation at http://www.dspguide.com/CH18.PDF
DSP Equalizer – FFT Convolution Figure 18-2 from http://www.dspguide.com/CH18.PDF - The Scientist and Engineer's Guide to Digital Signal Processing by Steven W. Smith, Ph.D.
Challenges • AC coupling on DSP • Since signal is fluctuating, average is zeroed out by DSP’s AC coupling • Should just be interpreted as non-negative DC value • Result is negative when signal should small or 0 Volts • Solution - change negative reference voltage on PIC
Challenges – AC Coupling on DSP • Cursors show LCD driver output is -359mV at times • -333mV reference used for PIC to ensure negative values are displayed as non-negative
Challenges • LCD Speed • Original PIC program was written to accommodate worst case timing for LCD display (anticipated 10ms draw time) • Sluggish performance with original code • PIC program had to be optimized to exit display interrupt as quickly as possible • Solution is to poll busy flag generated by LCD • Result is high frame rates and overall responsiveness of LCD
Challenges • DSP Fixed-point arithmetic • FFT scales outputs by 0.5 after each stage to avoid overflow • Radix-2 1024-pt FFT => 10 stages => loss of 10 bits of precision of 16 bits possible • Magnitude scaled by 1/20 • Output is barely audible and pervaded by quantization noise, evident after amplification • FFT Convolution algorithm works well in Matlab where environment is floating-point
Challenges • Graphic LCD • Higher resolution and more flexible for applications with complex graphics • Insufficient documentation • Manufacturer’s site lacked a quality datasheet • Solution: • HD44780 character display • Very well documented with many examples • Suitable for our application
Challenges • Serial Communication • Did not fully implement PIC to DSP serial communication • PIC was able to generate a stream of serial bits but DSP code incorrectly interpreted them
Successes • Equal log-spaced filters as desired • Filters cover entire audible range • Responsive LCD Display • High quality equalizer results in Matlab • PIC able to output information serially
Recommendations • Implement both display and EQ with embedded system • More channels of display and control • Larger memory capacity than DSP board for more accurate FFTs, more channel buffers • Floating-point CPU for preserving information when manipulating audio through FFT
Thank You • Questions?