Download
1 / 66
660 likes | 1.24k Vues
The History of Sampling. In 1936, Literary Digest conducted its most ... sampling frame used by the Digest: telephone subscribers and automobile owners. ...

E N D
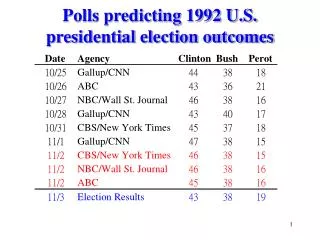
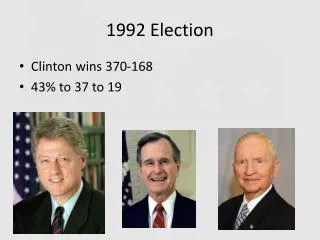
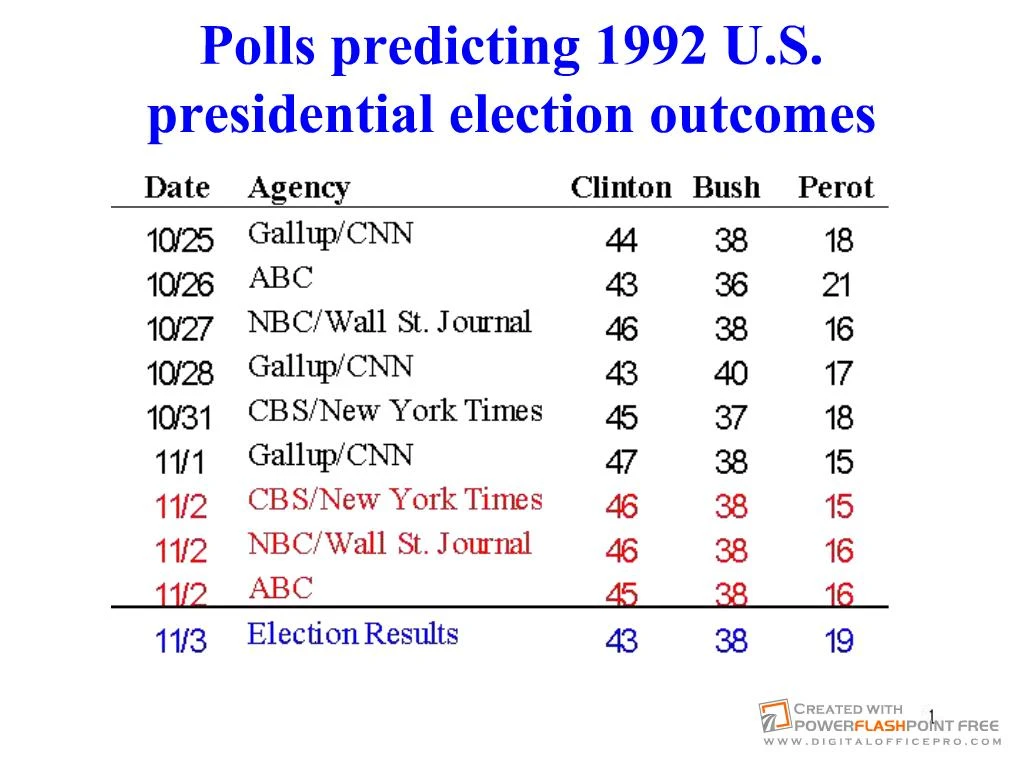
Slide 1:Polls predicting 1992 U.S. presidential election outcomes
Slide 2:Polls predicting 1996 U.S. presidential election outcomes
Slide 3:How many interviews it took to estimate the behaviors of 90 million voters?
Less than 2,000
Slide 4:The History of Sampling
In 1920, Literary Digest mailed postcards to people in 6 states, asking whom they were planning to vote for in the presidential campaign. The Digest correctly predicted that Harding would be elected. In the elections that followed, the Literary Digest expanded the size of its poll and made correct predictions in 1924, 1928, 1932.
Slide 5:The History of Sampling
In 1936, Literary Digest conducted its most ambitious poll: 10 million ballots were sent to people listed in the telephone directories and on lists of automobile owners. Over 2 million responded, given the Republican contender Alf London, a 57 to 43 percent landslide over the incumbent, president Roosevelt. Election results: Roosevelt won 61% of the votes.
Slide 6:The History of Sampling
Problem: 22% return rate. A part of the answer to these questions lay in the sampling frame used by the Digest: telephone subscribers and automobile owners. Such a design selected a disproportionately wealthy sample. The sample effectively excluded poor people, and the poor people predominantly voted for Roosevelt�s New Deal recovery program during the depression period.
Slide 7:The History of Sampling
In the same year (1936), George Gallup correctly predicted that Roosevelt would beat London. Gallup�s success in 1936 hinged on his use of quota sampling, which is based on a knowledge of the characteristics of the population being sampled. People are selected to match the population characteristics. Using quota sampling, Gallup successfully predicting the presidential winner in 1940 and 1944.
Slide 8:The History of Sampling
In 1948, Gallup mistakenly picked Thomas Dewey over incumbent president Harry Truman. Factors accounted for 1948�s failure: 1). Most of the pollsters stopped polling in early Oct despite a steady trend toward Truman during the campaign. 2). �Undecided� voters went disproportionately for Truman. 3). Unrepresentativeness of the sample (resulting from quota sampling).
Slide 9:The History of Sampling
Quota sampling technique requires that the researcher know something about the total population. For national political polls, such information came primarily from census data. By 1948, however, WWII had produced a massive movement from country to city, radically changing the character of the U.S. population, and Gallup relied on 1940 census data (City dwellers tended to vote Democratic; hence the over-representation of rural voters also underestimated the number of Democratic votes).
Slide 10:Why sample?
A sample may be more accurate than a census??????????,??: Accuracy and precision?????????????? Census of a large population increase the likelihood of nonsampling errors because of the increased volume of work. ???????????90%?????????? EX>Bureau of the Census uses samples to check the accuracy of the U.S. Census. Speed of response??????????? Cost Destructive sampling: ?????
Slide 11:Sampling Design
Sample designs Nonprobability samples Convenience Judgment Quota Snowball Probability samples Simple random Systematic Stratified Proportionate Disproportionate Cluster Multistage There are no appropriate statistical techniques for measuring random sampling error from a non-probability sample. Thus projecting the data beyond the sample is statistical inappropriate.
Slide 12:Nonprobability Sampling
Social research is often conducted in situations where you can't select the kinds of probability samples used in large-scale social surveys. Lack of population list: Suppose you wanted to study homelessness: There is no list of all homeless individuals, nor are you likely to create such a list.
Slide 13:Convenience Sampling
???? (haphazard or accidental sampling), relying on available subjects EX> man-on-the-street interviews, radio station call in to reflect public opinions. Talk to friend about their political sentiment EX> professor uses students as sample EX> every tenth student entering the university library. EX> Survey �over sea Chinese for international marketing?�
Slide 14:Convenience Sampling
Advantages: Very low cost, extensively used, No need for list of population. It is justified only if the researcher wants to study the characteristics of people passing the sampling point at specified times or if less risky sampling methods are not feasible.
Slide 15:Convenience Sampling
Problems: (1) no way of knowing if those included are representative. (2) Variability and bias of estimates cannot be measured or controlled. (3) Projecting the results beyond the specific sample is inappropriate. Should be use only for exploratory design to generate ideas and insights. you should alert readers to the risks associated with this method.
Slide 16:Judgment Samples (Purposive Samples)????
hand-picked sample elements, believed to be representative of the population of interest EX> a fashion manufacturer regularly selects a sample of key accounts that it believes are capable of providing the information to predict what will sell in the fall. EX> Dow Jones industrial average: select 30 blue-chip stocks out of 1,800 stocks. Highly correlated with other NYSE indicators on the daily percentages of price changes EX>Representative communities in U.S. presidential election. EX> CPI�????????
Slide 17:Snowball sample????
Locate an initial set of respondents. These individual are then used as informants to identify others with the desired characteristics. Appropriate when the members of a special population are difficult to locate. ????????????????
Slide 18:Snowball sample????
EX> survey users of an unusual product: a study among deaf for product that would allow deaf people to communicate over telephone. EX> ??????(????),homeless, gangsters, migrant workers, undocumented immigrants. EX> network study,????(HIV) Bias: a person who is known to someone has a higher probability of being similar to the first person.
Slide 19:Quota samples????
by selecting sample elements in such a way that the proportion of the sample elements possessing a certain characteristics is approximately the same as the proportion with the characteristics in the population. Establishing a characteristics matrix: What proportion of the target population is male and female? what proportions of each gender fall various age categories, educational level, ethnic groups,�etc. Once such a matrix has been created and a relative proportion assigned to each cell in the matrix, you collect data from people having all the characteristics of a given cell. All the persons in a given cell are then assigned a weight appropriate to their portion of the total population.
Slide 20:Quota samples????
Problems: The sample could be far off with respect to other important characteristics. The quota frame must be accurate, and it is often difficult to get up-to-date information for this purpose.
Slide 21:Quota samples????
Biases may exist in the selection of sample elements within a given cell. The interviewer has a quota to achieve. The actual choice of elements left to the discretion of the individual field worker. Interviewers are prone to follow certain practices
Slide 22:Quota samples????
those who are similar to the interviewers are more likely to be interviewed, toward the accessible (first floor, airline terminals, business district, college campus), toward household with children, exclude working people, against workers in manufacturing (service and administrative), against extreme of income (EX> "mansions" were skipped because the interviewer did not feel comfortable knocking on doors that were answered by servants. ), against the less educated, against low-status individuals
Slide 23:The logic of probability sampling
EPSEM (equal probability of selection method): a sample will be representative of the population from which it is selected if all members of the population have an equal chance of being selected in the sample. We must realize that even carefully selected EPSEM samples seldom (if ever) perfectly represent the populations from which they are drawn.
Slide 24:Probability sampling offers two advantages:
First, probability samples, although never perfectly representative, are typically more representative than other types of samples because the biases previously discussed are avoided. Second, and more important, probability theory permits us to estimate the accuracy or representativeness of the sample.
Slide 25:Population and Sample element
Element: An element is that unit about which information is collected and that provides the basis of analysis. People, families, corporations usually the same as unit of analysis Population: A population is the theoretically specified aggregation of study elements.
Slide 26:Defining the target population
It is vitally important to carefully define the target population so the proper source from which the data are to be collected can be identified. Question: "To whom do we want to talk?" What or who will be observed?---answer the questions about the tangible characteristics of the population (1) definition of the element (2) time referent for the study. EX> �????????� Or �female between age 12-50�?. EX>???????? EX> ???:?????????????????? EX> Industrial buyer behavior incorrectly define population as the purchasing agents but in fact, industrial engineers within the customer companies had substantial impact on buying decision.
Slide 27:Defining the study population
Study Population: A study population is that aggregation of elements from which the sample is actually selected. Lists of elements are usually somewhat incomplete ????????????????? ???????= ?????????
Slide 28:Sampling units
A sampling unit is that element or set of elements considered for selection in some stage of sampling. In a simple single-stage sample, the sampling units are the same as the elements and are probably the units of analysis. EX> passengers on a passengers list ? sampling unit = elements In a multi-stage sample: EX> the airlines could first select flights as the sampling unit, then select certain passengers on the previously select flights. PSU (primary sampling units) = flights Secondary sampling units = passengers
Slide 29:Sampling frame
A sampling frame is the actual list of sampling units from which the sample, or some stage of the sample, is selected. Also referred to as the working population. In single-stage sampling designs, the sampling frame is simply a list of the study population. Almost all sampling frame exclude some members of the population. A sampling frame error occurs when certain sample elements are excluded or when the entire population is not accurately represented in the sample frame. We often begin with a population in mind for our study; then we search for possible sampling frames, the frames available for our use are examined and evaluated.
Slide 30:Observation unit
An observation unit, or unit of data collection, is an element or aggregation of elements from which information is collected. EX) Researcher may interview heads of households (the observation units) to collect information about all members of the households (the units of analysis).
Slide 31:Types of Sampling Designs
Simple Random Sampling Systematic Sampling Stratified Sampling Cluster Sampling
Slide 32:Simple Random Sampling??????
Simple random sampling is the basic sampling method assumed in the statistical computations of social research. Establish a sampling frame Assigns a single number to each element in the list, not skipping any number in the process. generates series of random numbers to select the elements Simple random sampling is seldom used in practice
Slide 33:Systematic Sampling????
A systematic sample with a random start--a procedure in which an initial starting point is selected by a random process, and then every kth number on the list is selected. Sampling interval: the number of population elements between the units selected for the sample. Sampling interval = population size / sample size Sampling ratio = sample size / population size Systematic sampling is virtually identical to simple random sample. If the list of elements is indeed randomized before sampling, one might argue that a systematic sample drawn from that list is in fact a simple random sample. Systematic sampling is much easier to conduct.
Slide 34:Problem of periodicity
The arrangement of elements in the list can make systematic sampling unwise. EX> collecting retail sales information every seventh day (Monday) EX> when the list is not randomly distribute: a list of contributors (donors) ranked by amount of donations. EX> apartment number
Slide 35:Stratified Random Sampling????
Recall that sampling error can be reduced by (1) increase sampling size (2) a homogeneous population produces samples with smaller sampling errors than does a heterogeneous population. The logic of stratified sampling: rather than selecting your sample from the total population at large, you ensure that appropriate numbers of elements are drawn from homogeneous subsets of that population.
Slide 36:Stratified Random Sampling????
The parent population is divided into mutually exclusive and exhaustive subsets. A simple random sample of elements is chosen independently from each group or subset. To organize the population into homogeneous subsets and to select the appropriate number of elements from each.?????????(strata),??????????????????????
Slide 37:Stratified Random Sampling????
EX> urban and rural groups differ widely on attitudes toward energy conservation, members within each group hold very similar attitudes. EX> divide the university by college class (freshmen, sophomores, juniors, seniors) In selecting stratification variables, you should be concerned primarily with those that are presumably related to variables that you want to represent accurately. Such as sex, education, geographic location,�etc. EX> estimate income stratified by educational level.
Slide 38:Stratified Random Sampling????
??????????????????(homogeneous within strata),??????????(sampling error is smaller)? The investigator should divide the population into strata so that the elements within any given stratum are as similar in value as possible and the values between any two strata are as disparate as possible. In the limit, if the investigator is successful in partitioning the population so that the elements in each stratum are exactly equal, there will be no error associated with the estimate of the population parameters.
Slide 39:Increased precision of stratified samples
EX> N=1,000 Mean = 5 (.2) + 10 (.3) + 20 (.5)= 14, variance = 39 Suppose that a researcher was able to partitioning the total population so that all the elements with a value of 5 in one stratum, those with value of 10 were in the second, and those with the value of 20 were in the third. Take a proportionate stratified sample of n=10. Or select a sample of n=3, and calculate the weighted average.
Slide 40:Proportional stratified sample
Proportional stratified sample: the number of sampling units drawn from each stratum is in proportion to the relative population size of that stratum. (1) Sort the population into discrete groups (2) On the basis of relative proportion of the population represented by a given group, select several elements from tat group constituting the same proportion of y our desired sample size. (1) Group elements and then put groups together in a continuous list (an ordered list, if no periodicity, is sometime better than randomized list--implicit stratification in systematic sampling). (2) Select a systematic from the entire list.
Slide 41:Disproportionate stratified sampling
Balancing the two criteria of strata size and strata variability. Strata exhibiting more variability are sampled more than proportionately to their relative size; those strata that are very homogeneous are sampled less than proportionately.
Slide 42:Multistage cluster sampling????
Used when it is either impossible or impractical to compile an exhaustive list of the elements composing the target population. ??????(cluster),??(cluster)?????????????? EX) ????????????,??????????????????????,????????????????????????,?????? EX) census blocks---sampled blocked? sample household? sample individual EX> sampling high school students in Taiwan requires the entire student list. Cluster sampling: no initial listing is required.
Slide 43:Multistage cluster sampling????
????: ???,??????? ???????????????? ???????????????? ????: ???,??????? ???????????? ?????????????????????????
Slide 44:Multistage cluster sampling????
Price of the efficiency? less accurate sample: A simple random sample drawn from a population list is subject to a single sampling error, but a two-stage cluster sample is subject to two sampling errors. (ex> selecting a sample of disproportionately wealthy city blocks, plus a sample of disproportionately wealthy households within those blocks.) Tradeoff: With a given total sample size, if the number of clusters is increased, the number of elements within a cluster must be decreased. The representativeness of the clusters is increased at the expense of more poorly representing the elements composing each cluster.
Slide 45:Comparisons of sampling techniques
Slide 46:Comparisons of sampling techniques
Slide 47:Comparisons of sampling techniques
Slide 48:Comparisons of sampling techniques
Slide 49:Sampling Bias
A sample is biased if it is obtained by a method that favors the selection of elementary units having particular characteristics.
Slide 50:Sampling Error or Error of Estimation
Respondent error Systematic (nonsampling) error Error in survey research Random sampling error Administrative error Nonresponse error Response bias Deliberate falsification Unconscious misrepresentation Extremity bias Interviewer bias Auspices bias Social desirability bias Data processing error Sample selection error Interviewer error Interviewer cheating Acquiescence bias Self-selection bias Contamination by othersSlide 52:Random Sampling Error
A statistical fluctuation that occurs because of chance variation in the elements selected for a sample. Can be estimated. Can be reduce through increasing sample size.
Slide 53:Systematic Error???? �nonsampling errors
???????imperfect aspect of the research design ????????mistake in the execution of the research A sample bias exists when the results of a sample show a consistent tendency to deviate in one direction from the true value of the population parameter. Two general categories: ) Respondent error �Nonresponse error + Response bias ) Administrative error
Slide 54:Non-response error
The statistical difference between a survey that includes only those who responded and a survey that also includes those who failed to respond. Non-respondent�a person who is not contacted or who refuses to cooperate 1. not-at-home�married women 2. refusal � a person who is unwilling to participate.
Slide 55:Non-response error
To identify the extent of nonresponse error, business researcher often select a sample of nonrespondents who are then recontacted. ??????????????(call back or follow-up),?????????????? Comparing the demographics of the sample with the demographics of the target population is one mean of inspecting for possible bias. ???????? EX) 500??????????????????? EX> sample from the educational or personnel records
Slide 56:Self-selection bias
(EX) who are more likely to respond to customer satisfaction survey on the dining table? (EX) PC software--expert views on degree of "user friendly", might be more critical. Self-selection biases the survey because it allows extreme positions to be over-represented while those who are indifferent are under-represented????.
Slide 57:Deliberate falsification
Appear to be intelligent�EX> price of a good, reluctant to say "can't remember". Conceal personal information�EX>income, political attitude To avoid embarrassment�EX>sexual behaviors, smoking/drinking Become bored�to get rid of the interviewer Reluctant to give negative feeling�EX> in employee survey; to safeguard their job To please interviewer. �Average man" hypothesis�to conform to their perception of the average person. EX> number of hour worked.
Slide 58:Unconscious Misrepresentation
in the absence of strong preference, respondents will choose answers to justify their behavior�(EX) which PC is better? In-flights survey concerning aircraft preference Misunderstand the question--EX> philipine�toothpaste = Colgate Never thought about the question�buying intention, quitting intention Forgot the exact details�when was last time you�? How many times did you�?
Slide 59:Acquiescence bias
A tendency to agree with all questions or to indicate a positive connotation. �yea (no) sayers� EX> Japanese do not wish to contradict others particularly prominent in ideas previously unfamiliar to the respondents
Slide 60:Extremity bias (or avoid extreme position)
Consistently low or high scores were given to every question. EX) student evaluation of the class.
Slide 61:Interviewer bias
Bias due to the influence of the interviewer (mere presence) Provide the �right� answer to please interviewer; Appear intelligent and wealthy to �save face�. Interviewer�s age, sex, tone of voice, facial expressions, or other noverbal characteristics. Will interviewer�s gender make a difference when asking the following questions? EX)???????????,??????????? EX)??????????????????�? Interviewer shorten or rephrase question
Slide 62:Auspices bias
�bias in the responses of subjects caused by the respondents being influenced by the organization conducting the study. EX) ???? vs. ??????????????
Slide 63:Social desirability bias
�bias in the responses of subjects caused by respondent's desire, either consciously or unconsciously, to gain prestige or to appear in a different social role. inflated income �have you ever been fired from a job?� �Do you have roaches in your home?� �how many times you brash your teeth per day� Likelihood for social desirability bias: face-to-face > telephone > mail
Slide 64:Contamination by others
EX> complete a question on the satisfaction with family (marital) relationship (Under the presence of a spouse).
Slide 65:Administrative error
Data processing error Sample selection error�unlisted telephone respondent, stopping respondents during daytime hours in shopping center exclude working women, wrong household member answer the phone�etc. Interviewer error�check the wrong response, can't write fast enough to record answers, selective perception (take liberty in interpreting questions, specific words may unconsciously be emphasized). Interviewer cheating (deliberate subversion)� fills in the answers to certain questions, skip questions, in order to finish the question as soon as possible. remedy�mini-re-interviews: a percentage of respondent will be call upon to verify the data.
Slide 66:What can be done to reduce error:
Questionnaire design�to reduce response bias Sampling�to control random sampling error Interviewer training Use rule-of-thumb estimates for systematic error based on the result of other studies (areas), create benchmark figures or standards of comparison� EX>� of those who say they �will definitely buy � within the next three months actually do make a purchase. For durable�1/3. "will probably buy" durable = no actual buy