Download
1 / 84
840 likes | 1.31k Vues
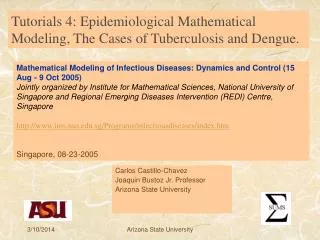
Tutorials 4: Epidemiological Mathematical Modeling, The Cases of Tuberculosis and Dengue. Mathematical Modeling of Infectious Diseases: Dynamics and Control (15 Aug - 9 Oct 2005)

E N D
Tutorials 4: Epidemiological Mathematical Modeling, The Cases of Tuberculosis and Dengue. Mathematical Modeling of Infectious Diseases: Dynamics and Control (15 Aug - 9 Oct 2005) Jointly organized by Institute for Mathematical Sciences, National University of Singapore and Regional Emerging Diseases Intervention (REDI) Centre, Singapore http://www.ims.nus.edu.sg/Programs/infectiousdiseases/index.htm Singapore, 08-23-2005 Carlos Castillo-Chavez Joaquin Bustoz Jr. Professor Arizona State University Arizona State University
A TB model with age-structure(Castillo-Chavez and Feng. Math. Biosci., 1998) Arizona State University
SIR Model with Age Structure • s(t,a) : Density of susceptible individuals with age a at time t. • i(t,a) : Density of infectious individuals with age a at time t. • r(t,a) : Density of recovered individuals with age a at time t. # of susceptible individuals with ages in (a1 , a2) at time t # of infectious individuals with ages in (a1 , a2) at time t # of recovered individuals with ages in (a1 , a2) at time t Arizona State University
Parameters • : recruitment/birth rate. • (a): age-specific probability of becoming infected. • c(a): age-specific per-capita contact rate. • (a): age-specific per-capita mortality rate. • (a): age-specific per-capita recovery rate. Arizona State University
Mixing p(t,a,a`): probability that an individual of age a has contact with an individual of age a` given that it has a contact with a member of the population . Arizona State University
Mixing Rules • p(t,a,a`) ≥ 0 • Proportionate mixing: Arizona State University
Equations Arizona State University
Demographic Steady State n(t,a): density of individual with age a at time t n(t,a) satisfies the Mackendrick Equation We assume that the total population density has reached this demographic steady state. Arizona State University
Parameters • : recruitment rate. • (a): age-specific probability of becoming infected. • c(a): age-specific per-capita contact rate. • (a); age-specific per-capita mortality rate. • k: progression rate from infected to infectious. • r: treatment rate. • : reduction proportion due to prior exposure to TB. • : reduction proportion due to vaccination. Arizona State University
Age Structure Model with vaccination Arizona State University
Vaccinated Age-dependent optimal vaccination strategies(Feng, Castillo-Chavez, Math. Biosci., 1998) Arizona State University
Basic reproductive Number (by next generation operator) Arizona State University
Stability There exists an endemic steady state whenever R0()>1. The infection-free steady state is globally asymptotically stable when R0= R0(0)<1. Arizona State University
Optimal Vaccination Strategies Two optimization problems: If the goal is to bring R0() to pre-assigned value then find the vaccination strategy (a) that minimizes the total cost associated with this goal (reduced prevalence to a target level). If the budget is fixed (cost) find a vaccination strategy (a) that minimizes R0(), that is, that minimizes the prevalence. Arizona State University
R(y) < R* Reproductive numbers Two optimization problems: Arizona State University
One-age and two-age vaccination strategies Arizona State University
Optimal Strategies One–age strategy: vaccinate the susceptible population at exactly age A. Two–age strategy: vaccinate part of the susceptible population at exactly age A1and the remaining susceptibles at a later age A2. . Selected optimal strategy depends on cost function (data). Arizona State University
Generalized Household Model • Incorporates contact type (close vs. casual) and focus on close and prolonged contacts. • Generalized households become the basic epidemiological unit rather than individuals. • Use epidemiological time-scales in model development and analysis. Arizona State University
Transmission Diagram Arizona State University
Key Features • Basic epidemiological unit: cluster (generalized household) • Movement of kE2 to I class brings nkE2 to N1population, where by assumptions nkE2(S2 /N2) go to S1 and nkE2(E2/N2) go to E1 • Conversely, recovery of I infectious bring nI back to N2 population, where nI (S1 /N1)= S1 go to S2 and nI (E1 /N1)= E1 go to E2 Arizona State University
Basic Cluster Model Arizona State University
Basic Reproductive Number Where: is the expected number of infections produced by one infectious individual within his/her cluster. denotes the fraction that survives over the latency period. Arizona State University
Diagram of Extended Cluster Model Arizona State University
(n) Both close casual contacts are included in the extended model. The risk of infection per susceptible, , is assumed to be a nonlinear function of the average cluster size n. The constant p measuresproportion of time of an “individual spanned within a cluster. Arizona State University
Role of Cluster Size (General Model) E(n) denotes the ratio of within cluster to between cluster transmission. E(n) increases and reaches its maximum value at The cluster size n* is optimal as it maximizes the relative impact of within to between cluster transmission. Arizona State University
Full system Hoppensteadt’s Theorem (1973) Reduced system where x Rm, y Rn and is a positive real parameter near zero (small parameter). Five conditions must be satisfied (not listed here). If the reduced system has a globally asymptotically stable equilibrium, then the full system has a g.a.s. equilibrium whenever 0< <<1. Arizona State University
1 Bifurcation Diagram Global bifurcation diagram when 0<<<1 where denotes the ratio between rate of progression to active TB and the average life-span of the host (approximately). Arizona State University
Numerical Simulations Arizona State University
Concluding Remarks on Cluster Models • A global forward bifurcation is obtained when << 1 • E(n) measures the relative impact of close versus casual contacts can be defined. It defines optimal cluster size (size that maximizes transmission). • Method can be used to study other transmission diseases with distinct time scales such as influenza Arizona State University
TB in the US (1953-1999) Arizona State University
TB control in the U.S. CDC’s goal 3.5 cases per 100,000 by 2000 One case per million by 2010. Can CDC meet this goal? Arizona State University
Model Construction Since d has been approximately equal to zero over the past 50 years in the US, we only consider Hence, N can be computed independently of TB. Arizona State University
Non-autonomous model (permanent latent class of TB introduced) Arizona State University
Effect of HIV Arizona State University
Parameter estimation and simulation setup Arizona State University
N(t) from census data N(t) is from census data and population projection Arizona State University
Results Arizona State University
Results • Left: New case of TB and data (dots) • Right: 10% error bound of new cases and data Arizona State University
Regression approach Arizona State University A Markov chain model supports the same result
CONCLUSIONS Arizona State University
Conclusions Arizona State University
CDC’s Goal Delayed Impact of HIV. • Lower curve does not include HIV impact; • Upper curve represents the case rate when HIV is included; • Both are the same before 1983. Dots represent real data. Arizona State University
Our work on TB • Aparicio, J., A. Capurro and C. Castillo-Chavez, “On the long-term dynamics and re-emergence of tuberculosis.” In: Mathematical Approaches for Emerging and Reemerging Infectious Diseases: An Introduction, IMA Volume 125, 351-360, Springer-Veralg, Berlin-Heidelberg-New York. Edited by Carlos Castillo-Chavez with Pauline van den Driessche, Denise Kirschner and Abdul-Aziz Yakubu, 2002 • Aparicio J., A. Capurro and C. Castillo-Chavez, “Transmission and Dynamics of Tuberculosis on Generalized Households”Journal of Theoretical Biology 206, 327-341, 2000 • Aparicio, J., A. Capurro and C. Castillo-Chavez, Markers of disease evolution: the case of tuberculosis, Journal of Theoretical Biology, 215: 227-237, March 2002. • Aparicio, J., A. Capurro and C. Castillo-Chavez, “Frequency Dependent Risk of Infection and the Spread of Infectious Diseases.” In: Mathematical Approaches for Emerging and Reemerging Infectious Diseases: An Introduction, IMA Volume 125, 341-350, Springer-Veralg, Berlin-Heidelberg-New York. Edited by Carlos Castillo-Chavez with Pauline van den Driessche, Denise Kirschner and Abdul-Aziz Yakubu, 2002 • Berezovsky, F., G. Karev, B. Song, and C. Castillo-Chavez, Simple Models with Surprised Dynamics, Journal of Mathematical Biosciences and Engineering, 2(1): 133-152, 2004. • Castillo-Chavez, C. and Feng, Z. (1997), To treat or not to treat: the case of tuberculosis, J. Math. Biol. Arizona State University
Our work on TB • Castillo-Chavez, C., A. Capurro, M. Zellner and J. X. Velasco-Hernandez, “El transporte publico y la dinamica de la tuberculosis a nivel poblacional,” Aportaciones Matematicas, Serie Comunicaciones, 22: 209-225, 1998 • Castillo-Chavez, C. and Z. Feng, “Mathematical Models for the Disease Dynamics of Tuberculosis,” Advances In Mathematical Population Dynamics - Molecules, Cells, and Man (O. , D. Axelrod, M. Kimmel, (eds), World Scientific Press, 629-656, 1998. • Castillo-Chavez,C and B. Song: Dynamical Models of Tuberculosis and applications, Journal of Mathematical Biosciences and Engineering, 1(2): 361-404, 2004. • Feng, Z. and C. Castillo-Chavez, “Global stability of an age-structure model for TB and its applications to optimal vaccination strategies,” Mathematical Biosciences, 151,135-154, 1998 • Feng, Z., Castillo-Chavez, C. and Capurro, A.(2000), A model for TB with exogenous reinfection, Theoretical Population Biology • Feng, Z., Huang, W. and Castillo-Chavez, C.(2001), On the role of variable latent periods in mathematical models for tuberculosis, Journal of Dynamics and Differential Equations . Arizona State University