Download
1 / 37

E N D
1. INTRODUCTION TO EXCHANGE RATES AND THE FOREIGN EXCHANGE MARKET
3. Chapter Outline The Market for Foreign Exchange
The Spot Contract
Transaction Costs
Derivatives
Private Actors
Government Actions
Arbitrage and spot exchange rates
Arbitrage with Currencies
Cross Rates and Vehicle Currencies
4. Chapter Outline Arbitrage and interest rates
Riskless Arbitrage: Covered Interest Parity (CIP)
Risky Arbitrage: Uncovered Interest Parity (UIP)
Uncovered Interest Parity: A Useful Approximation
Conclusions
5. LEARNING OBJECTIVES:1. Exchange Rate Essentials Define the exchange rate between home and foreign currencies
Define appreciations and depreciations and understand how they related to exchange rate movements
Use exchange rates to convert prices into a common currency
Analyze how changes in exchange rates affect the relative prices of goods from different countries
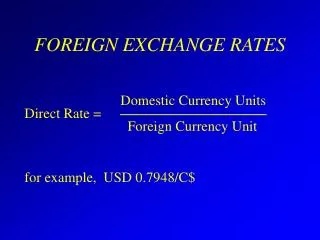
6. Defining the Exchange Rate Exchange rate (Edomestic/foreign)
The price of a unit of foreign currency in terms of domestic currency for immediate purchase.
The exchange rate E measures the relative price of one currency in terms of another.
For example: if the U.S. dollar price of 1 U.K. pound sterling (�1) is $1.85, then E$/� = 1.85.
7. Be Careful� Always take care with units
For any pair of currencies, the exchange rate can be expressed two ways, where one way is the inverse of the other
For example: suppose the U.S. dollar price of 1 euro (�1) is $1.15, then E$/� = 1.15.
This is known as the �American terms.� (What Americans must pay in dollars to buy European currency.)
If 1 euro is worth $1.15, how much is $1 worth?
Taking the inverse, E$/� = 1/1.15 = 0.87.
This is known as the �European terms.� (What Europeans must pay in euros to buy U.S. currency.)
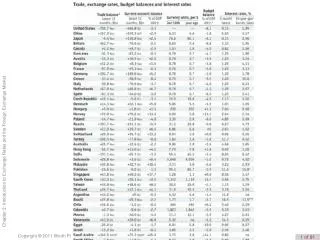
8. Examples of Exchange Rate Quotations Table 2.1: Exchange Rate Quotations This table shows major exchange rates as they might appear in the financial media. Columns (1) to (3) show rates on June 1, 2007. For comparison, columns (4) to (6) show rates on June 1, 2006. For example, column (1) shows that on June 1, 2007, one U.S. dollar was worth 1.064 Canadian dollars, 5.551 Danish krone, 0.745 euros, and so on. The euro-dollar rates appear in bold type.
Table 2.1: Exchange Rate Quotations This table shows major exchange rates as they might appear in the financial media. Columns (1) to (3) show rates on June 1, 2007. For comparison, columns (4) to (6) show rates on June 1, 2006. For example, column (1) shows that on June 1, 2007, one U.S. dollar was worth 1.064 Canadian dollars, 5.551 Danish krone, 0.745 euros, and so on. The euro-dollar rates appear in bold type.
9. Appreciations and Depreciations Definitions
If a currency starts to buy more of another currency we say it has appreciated against that currency.
If a currency starts to buy less of another currency we say it has depreciated against that currency.
It is important to note the definition of the exchange rate, in order to understand which currency appreciates and which depreciates.
10. Example The value of 1 euro
Example: consider the exchange rate E$/�
E$/�,t = $1.06, E$/� ,t+1 = $1.28
A euro buys D?E$/� / E$/� = 0.22/1.06 = 21% more U.S. dollars.
We would say the euro has appreciated by (about) 21% against the U.S. dollar.
11. Example The value of 1 dollar
Example: the exchange rate E�/$
E�/$,t = �0.95, E�/$,t+1 = �0.78
A U.S. dollar buys D?E�/$ / E�/$ = 0.17/0.95 = 18% fewer euros.
The dollar has depreciated by (about) 18% against the euro.
12. Appreciations and Depreciations Key points:
When the U.S. exchange rate E$/� is rising the dollar is depreciating
When the U.S. exchange rate E$/� is falling the dollar is appreciating
Also note that the % home depreciation approximately equals the % foreign appreciation
The exchange rates are reciprocals of each other.
The approximation is valid for small changes.
13. Multilateral Exchange Rates The bilateral exchange rate, as seen above, shows the price at which one currency is exchanged for another.
In practice, it is possible for one currency to appreciate relative to one currency, while depreciating relative to another.
In order to understand the �average� change in the value of a currency, we need to use a multilateral exchange rate.
14. Multilateral Exchange Rates The nominal effective exchange rate (NEER) is calculated as the sum of the trade shares multiplied by the exchange rate changes for each country.
The dollar weight of each currency in the basket (in a base year) is given by the share of that country in U.S. trade.
Changes in the dollar price of this basket tell us how the value of the dollar has changed �on average� against the entire basket of currencies.
The NEER shows these changes against all foreign currencies �on average�.
15. Computing the NEER
If the home country trades with countries 1,�,N then the fractional (%) change in NEER relative to the base year is given by finding the trade-weighted average change in each bilateral exchange rate:
Multilateral Exchange Rates
17. How Much Has the Dollar Fallen? Figure 2.1: Effective Exchange Rates: Change in the Value of the U.S. Dollar, 2002�2006 The chart shows the value of the dollar measured by the U.S. Federal Reserve using two different baskets of foreign currencies, starting with the index set to 100 foreign baskets in January 2002. Against a basket of 7 major currencies, the dollar had depreciated by more than 25% by late 2004. Against a broad basket of 26 currencies, the dollar had lost only 15% of its value. This is because the dollar was floating against the major currencies, but the broad basket included important U.S. trading partners (such as China and other Asian economies) that maintained fixed or tightly managed exchange rates against the dollar.
Note: Seven of the 26 currencies in the broad index�the euro, Canadian dollar, Japanese yen, British pound, Swiss franc, Australian dollar, and Swedish krona�trade widely in currency markets outside their home areas, and (along with the U.S. dollar) they are referred to by the Federal Reserve Board as ��major�� currencies.
Source: U.S. Federal Reserve.
Figure 2.1: Effective Exchange Rates: Change in the Value of the U.S. Dollar, 2002�2006 The chart shows the value of the dollar measured by the U.S. Federal Reserve using two different baskets of foreign currencies, starting with the index set to 100 foreign baskets in January 2002. Against a basket of 7 major currencies, the dollar had depreciated by more than 25% by late 2004. Against a broad basket of 26 currencies, the dollar had lost only 15% of its value. This is because the dollar was floating against the major currencies, but the broad basket included important U.S. trading partners (such as China and other Asian economies) that maintained fixed or tightly managed exchange rates against the dollar.
Note: Seven of the 26 currencies in the broad index�the euro, Canadian dollar, Japanese yen, British pound, Swiss franc, Australian dollar, and Swedish krona�trade widely in currency markets outside their home areas, and (along with the U.S. dollar) they are referred to by the Federal Reserve Board as ��major�� currencies.
Source: U.S. Federal Reserve.
19. Example: Using Exchange Rates to Compare Prices in a Common Currency This table shows how the hypothetical cost of James Bond�s next tuxedo in different locations depends on the exchange rates that prevail.
Local prices are �2000, HK$30000, $4000.
Convert to �.
Table 2.2: Using the Exchange Rate to Compare Prices in a Common Currency Now pay attention 007! This table shows how the hypothetical cost of James Bond�s next tuxedo in different locations depends on the exchange rates that prevail.
Table 2.2: Using the Exchange Rate to Compare Prices in a Common Currency Now pay attention 007! This table shows how the hypothetical cost of James Bond�s next tuxedo in different locations depends on the exchange rates that prevail.
20. Example: Using Exchange Rates to Compare Prices in a Common Currency Scenario 1: Indifferent between three markets
Hong Kong: HK$30,000/15 HK$ per � = �2,000
New York: $4,000/ $2 per � = �2,000
Scenario 2: Buy tuxedo in Hong Kong
Hong Kong: HK$30,000/16 HK$ per � = �1,875
New York: $4,000/ $1.9 per � = �2,105
Scenario 3: Buy tuxedo in New York
Hong Kong: HK$30,000/14 HK$ per � = �2,143
New York: $4,000/ $2.1 per � = �1,905
Scenario 4: Buy tuxedo in London
Hong Kong: HK$30,000/14 HK$ per � = �2,143
New York: $4,000/ $1.9 per � = �2,105
21. Example: Using Exchange Rates to Compare Prices in a Common Currency Lessons
When comparing goods and services across countries, we can use the exchange rate to compare prices in same currency terms.
Changes in the exchange rate affect the relative prices of goods across countries:
Appreciation in the home currency leads to an increase in the relative price of its exports to foreigners and a decrease in the relative price of imports from abroad.
A depreciation in the home currency leads to a decrease in the relative price of its exports to foreigners and an increase in the relative price of imports from abroad.
22. LEARNING OBJECTIVES 2. Exchange Rates in Practice Gain familiarity with different kinds of observed exchange rate behavior
Understand the classification of this behavior via exchange rate regimes
Understand a simple and coarse classification that is widely used: fixed versus floating
Learn the classifications of exchange rate regimes and be aware of the existence of intermediate regimes
23. Exchange Rate Regimes: Fixed versus Floating To build models that explain observed behavior, it is important to become familiar with common patterns.
Exchange-rate regimes refer to categories that reflect policy choices made by governments.
For most purposes, two general categories of exchange-rate behavior are sufficient:
Fixed exchange-rate regimes
Floating exchange-rate regimes
24. Exchange Rate Regimes: Fixed versus Floating Fixed exchange rate (pegged exchange rate)
Where a country�s exchange rate does not fluctuate at all (or only narrowly) against some base currency over a sustained period, usually a year or longer.
Government intervention in the market for foreign exchange is needed to maintain the fixed exchange rate.
Floating exchange rate (flexible exchange rate)
A country�s exchange rate typically fluctuates over time.
The government makes no attempt to peg the exchange rate against a base currency.
Appreciations and depreciations may occur from year to year, each month, even by the day or every minute.
The amplitude or volatility of these fluctuations may vary greatly from one floating regime to another
25. Figure 2.2: Exchange Rate Behavior: Selected Developed Countries, 1996�2007 This figure shows exchange rates of three currencies against the U.S. dollar and three against the euro. The euro rates begin in 1999 when the currency was introduced. The yen, pound, and Canadian dollar all float against the U.S. dollar. The pound and yen float against the euro. The Danish krone is fixed against the euro.
Figure 2.2: Exchange Rate Behavior: Selected Developed Countries, 1996�2007 This figure shows exchange rates of three currencies against the U.S. dollar and three against the euro. The euro rates begin in 1999 when the currency was introduced. The yen, pound, and Canadian dollar all float against the U.S. dollar. The pound and yen float against the euro. The Danish krone is fixed against the euro.
26. Recent Exchange Rate ExperiencesDeveloped Countries Developed Countries
There is a great deal of short-run exchange rate volatility.
U.S. dollar is floating relative to the Japanese yen, British pound, and Canadian dollar (also known as the �loonie�)
Patterns for the euro are similar.
Danish krone maintains a �2% exchange rate band to the euro through intervention by the Danish central bank.
27. Recent Exchange Rate Experiences Developing Countries Figure 2.3: Exchange Rate Behavior: Selected Developing Countries, 1996�2007 Exchange rates in developing countries show a wide variety of experiences and greater volatility. Pegging is common but is punctuated by periodic crises (you can see the effects of these crises in graphs for Thailand, South Korea, and Argentina). Rates that are unpegged may show some flexibility (India). Some rates crawl gradually (Colombia). Dollarization can occur (Ecuador). The vertical scale ranges by a factor of three on the upper charts and by a factor of ten on the lower charts.
Source: oanda.com.
Figure 2.3: Exchange Rate Behavior: Selected Developing Countries, 1996�2007 Exchange rates in developing countries show a wide variety of experiences and greater volatility. Pegging is common but is punctuated by periodic crises (you can see the effects of these crises in graphs for Thailand, South Korea, and Argentina). Rates that are unpegged may show some flexibility (India). Some rates crawl gradually (Colombia). Dollarization can occur (Ecuador). The vertical scale ranges by a factor of three on the upper charts and by a factor of ten on the lower charts.
Source: oanda.com.
28. Recent Exchange Rate Experiences Developing Countries Developing Countries
Exchange rates in developing countries tend to be more volatile.
Some countries adopted fixed exchange rate regimes, but were forced to abandon the peg after an exchange rate crisis.
Many have adopted variants of fixed exchange rate regimes
Managed float, designed to prevent dramatic changes in the exchange rate without committing to a strict peg.
Crawl, where the exchange rate follows a trend, rather than a strict peg.
29. Recent Exchange Rate Experiences There are official and unofficial exchange rate regimes.
The difference occurs because some countries that adopt one regime follow another in practice.
E.g., they say they float but they really peg.
Instead of fixed and floating there is a continuum
Free floating versus managed floating
Crawls and bands allow some movement
No such movement in a hard peg; sometimes this takes the form of a currency board, a very hard peg with special rules (as we shall see later).
Some countries have no currency of their own.
30. Figure 2.4 A Spectrum of Exchange Rate Regimes The chart shows the spectrum of exchange rate regimes around the world as of July 31, 2006.
Source: IMF, De Facto Classification of Exchange Rate Regimes and Monetary Policy Framework, July 31, 2006.Figure 2.4 A Spectrum of Exchange Rate Regimes The chart shows the spectrum of exchange rate regimes around the world as of July 31, 2006.
Source: IMF, De Facto Classification of Exchange Rate Regimes and Monetary Policy Framework, July 31, 2006.
33. The Market for Foreign Exchange Overview
The foreign exchange market has no central organized market or exchange
Foreign exchange market has no exchange trading.
Over-the-counter trading (OTC) - bilaterally between two parties.
Large market
$3.2 trillion traded per day (April 2007)
Main centers account for more than 50% of transactions:London, New York, and Tokyo
Trades spread over most time zones
34. The Market for Foreign Exchange The Spot Contract
How the spot contract works:
A and B agree to trade one currency for another for delivery on the spot at set price.
The price they agree upon is known as the spot exchange rate.
Characteristics of the spot market
Default risk very low; settlement is now nearly instantaneous.
Most common type of trade, accounting for nearly 90% of all foreign exchange market transactions.
Personal transactions account for a very small share of total transactions.
35. The Market for Foreign Exchange Transaction Costs
Costs associated with conducting trades in a market.
Spread
Difference between the �buy at� and �sell for� prices.
Example of a market friction or transaction cost that create a wedge between the price paid by the buyer and the price received by the seller.
Reflects intermediaries standing between the individual seeking to exchange currency and the centralized foreign exchange market.
Spreads are larger for individuals than they are for banks and corporations involved in large-volume transactions.
36. The Market for Foreign Exchange Derivatives
Derivatives are contracts with pricing derived from the spot rate.
Derivatives allow investors to trade foreign exchange for delivery at different times and at different contingencies.
In general, derivatives allow investors to alter payoffs, affecting the risk associated with his/her collection of investments (e.g., portfolio).
Hedging: risk reduction
Speculation: risk taking.
Types: forwards, swaps, futures, and options.
38. Foreign Exchange Derivatives Futures
A and B agree to trade currencies at set price in the future. Either side of contract can be traded to third parties C, D, E,� (on exchanges). Parties left holding contract must deliver.
Options
A grants to B option to buy (call) or sell (put) currencies from/to A, at set price in the future. B may or may not execute the option, but if B opts to execute the contract then A must deliver.
39. Foreign Exchange Derivatives Examples of how derivatives work
Example 1: Hedging
A Chief Financial Officer (CFO) of a U.S. firm expects to receive payment of �1 million in 90 days for exports to France.
The current spot rate is $1.10 per euro. The Chief Executive Officer (CEO) knows that severe losses would be incurred on the deal, if the dollar strengthened (i.e., the euro weakened) to less than $1 per euro.
What should the CFO do?
Buy �1 million in call options on $ at rate of $1.05 per euro
Insures the firm�s euro receipts will sell for at least this rate.
The call option guarantees the firm a profit, even if the spot rate falls below $1.05.
40. Foreign Exchange Derivatives Examples of how derivatives work
Example 2: Speculation
One-year euro futures are currently priced at $1.20.
You expect the dollar will depreciate to $1.32 in the next 12 months.
What should you do? Buy these futures
If you are proved right you will earn a 10% profit. Any level above $1.20 will generate a profit.
If the dollar is at or below $1.20 a year from now, however, your investment in futures will be a total loss.
42. The Market for Foreign Exchange Private Actors
Other players
Major corporations (e.g., multinationals)
Nonbank financial firms (e.g., mutual funds)
By trading directly in the foreign exchange market, other players avoid paying fees and commissions charged by commercial banks.
The volume of transactions needs to be large enough to make in-house currency trading worthwhile.
43. The Market for Foreign Exchange Government Intervention
Governments may try to control or regulate the foreign exchange market. The government may:
Impose capital controls to limit trading.
Establish an official market for foreign exchange at government-set rates.
This usually leads to the creation of a black market (illegal transactions at rates that differ from the official ones).
Try to shut down the foreign exchange market through outlawing trading.
Most often, government takes less drastic measures, relying on intervention to control foreign exchange prices. This is usually the responsibility of the central bank.
44. LEARNING OBJECTIVES 4. Arbitrage and Spot Exchange Rates Understand the (near) equalization of exchange rates in different locations.
How this result is ensured through the process of arbitrage under conditions of capital mobility.
Understand the meaning and uses of cross rates.
45. Arbitrage and Spot Exchange Rates Overview
An important goal of players in the forex market is to exploit arbitrage opportunities.
Arbitrage refers to a trading strategy that exploits price differences.
The purest form of arbitrage involves no risk and no capital.
The opportunity to make a riskless profit through trading.
Market equilibrium
No-arbitrage condition = no riskless profit opportunities
46. Arbitrage and Spot Exchange Rates Arbitrage with Two Currencies
Example
Take advantage of differences in price of dollars quoted in New York and London:
E�/$NY = �0.50 per dollar
E�/$London = �0.55 per dollar
A NY trader can make a riskless profit by selling $1 in London for 55p, using the proceeds to buy 55/50=$1.10 dollars in NY.
An instant 10% riskless profit!
47. Arbitrage and Spot Exchange Rates Arbitrage with Two Currencies
Example:
Market adjustment of the �/$ exchange rate
As investors take advantage of this arbitrage opportunity, the demand for dollars in NY rises, causing an increase in the exchange rate (� price of $ rises).
Similarly, the supply of dollars in London rises, causing a decrease in the exchange rate (� price of $ falls).
This process continues until the exchange rates in London and New York converge to the same level.
Differences mean that there are riskless profits lying around
In today�s markets, equalization occurs very, very quickly indeed!
Miniscule spreads may remain (less than 0.1%), due to transaction costs.
48. Arbitrage and Spot Exchange Rates Figure 2.6: Arbitrage and Spot Rates Arbitrage ensures that the trade of currencies in New York along the path AB occurs at the same exchange rate as via London along path ACDB. At B the pounds received must be the same. Regardless of the route taken to get to B.
Figure 2.6: Arbitrage and Spot Rates Arbitrage ensures that the trade of currencies in New York along the path AB occurs at the same exchange rate as via London along path ACDB. At B the pounds received must be the same. Regardless of the route taken to get to B.
49. Arbitrage with Three Currencies
The cross rate allows us to compare exchange rates defined in terms of different currencies.
For example, consider the bilateral exchange rate E�/$.
This can be expressed in terms of E�/$ and E�/�:
The fact that any two currencies must have equal prices in two different locations implies the same for a triangular trade involving three currencies. Arbitrage and Spot Exchange Rates
50. Arbitrage and Spot Exchange Rates Arbitrage with Three Currencies Figure 2.7: Arbitrage and Cross Rates Triangular arbitrage ensures that the direct trade of currencies along the path AB occurs at the same exchange rate as via a third currency along path ACB. The euros received at B must be the same on both paths, and E�/$ = E�/�E�/$.
Figure 2.7: Arbitrage and Cross Rates Triangular arbitrage ensures that the direct trade of currencies along the path AB occurs at the same exchange rate as via a third currency along path ACB. The euros received at B must be the same on both paths, and E�/$ = E�/�E�/$.
51. Arbitrage and Spot Exchange Rates Cross Rates and Vehicle Currencies
The vast majority of currency pairs are exchanged through a third currency.
This is because some foreign exchange transactions are relatively rate, making it more difficult to exchange currency directly.
When a third currency is used in these types of transactions, it is known as a vehicle currency.
As of April 2007, the most common vehicle currency was the U.S. dollar � used in 86% of all foreign exchange transactions.
The euro, Japanese yen, and British pound are also used as vehicle currencies.
52. LEARNING OBJECTIVES 5. Arbitrage and Interest Rates Understand riskless interest arbitrage using the spot and forward contract.
No arbitrage condition: covered interest parity (CIP).
Understand risky interest arbitrage using only spot contracts.
No arbitrage condition: uncovered interest parity (UIP).
Understand and apply UIP approximation.
53. Arbitrage and Interest Rates Overview of the two kinds of arbitrage
Exchange rate risk refers to changes in the value of an asset due to a change in the exchange rate.
Riskless arbitrage
Investor covers the risk of the exchange rate changing in the future by using a forward contract.
No exchange rate risk because there is no chance the exchange rate on the contract will change.
No-arbitrage condition is known as covered interest parity (CIP).
Risky arbitrage
Investor does not cover the risk and invests according to the current and expected future exchange rate.
Since the future spot exchange rate is not know, there is exchange rate risk � the investor is not covered against this risk
No-arbitrage condition is known as uncovered interest parity (UIP).
54. Riskless Arbitrage: Covered Interest Parity Forward Exchange Rate
The price of forward contracts.
Forward contracts allow investors holding deposits in foreign currencies to be certain about the future value of these deposits (measured in home currency).
No exchange rate risk in the future.
Riskless arbitrage implies that the rate of return on identical investments in two different locations will generate the same rate of return.
55. Riskless Arbitrage: Covered Interest Parity Example: Consider investing $1 in a bank deposit in two places: New York and Europe.
In one year, you will earn a (1+i$) rate of return in dollars in the account in New York.
In one year, you will earn a (1+i�) rate of return in euros in the account in Europe.
Not comparable! Different currencies!
We must calculate the dollar return in Europe:
Today, one U.S. dollar buys 1/ E$/� euros.
In one year, you will have (1+i�)/E$/� euros.
You do not know the E$/� spot exchange rate that will prevail in one year when you convert your euros back into U.S. dollars
You may choose to employ a forward contract to cover this risk.
In this case, your rate of return on the European deposit would be (1+i�)F$/�/E$/� U.S. dollars.
Riskless arbitrage implies these two strategies will yield the same rate of return in dollars.
56. Covered Interest Parity (CIP) condition
No arbitrage condition
For the market to be in equilibrium the riskless returns must be equal when expressed in a common currency: Riskless Arbitrage: Covered Interest Parity
57. Riskless Arbitrage: Covered Interest Parity Figure 2.8: Arbitrage and Covered Interest Parity Under CIP, returns to holding dollar deposits accruing interest going along the path AB must equal the returns from investing in euros going along the path ACDB with risk removed by use of a forward contract. Hence, at B, the riskless payoff must be the same on both paths, and (1 + i$) = F$/� /E$/� (1 + i�).
Figure 2.8: Arbitrage and Covered Interest Parity Under CIP, returns to holding dollar deposits accruing interest going along the path AB must equal the returns from investing in euros going along the path ACDB with risk removed by use of a forward contract. Hence, at B, the riskless payoff must be the same on both paths, and (1 + i$) = F$/� /E$/� (1 + i�).
58. Riskless Arbitrage: Covered Interest Parity Arbitrage profit?
Considers the German deutschmark (GER) relative to the British pound (UK), 1970-1994.
Determine whether foreign exchange traders could earn a profit through establishing forward and spot contracts
The profit from this type of arrangement is:
59. Figure 2.9: Financial Liberalization and Covered Interest Parity: Arbitrage between United Kingdom and Germany The chart shows the difference in monthly pound returns on deposits in British pounds and German marks using forward cover from 1970 to 1995. The implied profit from arbitrage is given by (1 + iGER)FUK/GER/EUK/GER - (1 + iUK). In the 1970s, the difference was positive and often large: traders would have profited from arbitrage by moving money from pound deposits to mark deposits, but capital controls prevented them from freely doing so. After financial liberalization, these profits essentially vanished, and no arbitrage opportunities remained. The CIP condition held, aside from small deviations resulting from transactions costs and measurement errors.
Source: Maurice Obstfeld and Alan M. Taylor, 2004, Global Capital Markets: Integration, Crisis, and Growth, Japan-U.S. Center Sanwa Monographs on International Financial Markets, Cambridge: Cambridge University Press.
Figure 2.9: Financial Liberalization and Covered Interest Parity: Arbitrage between United Kingdom and Germany The chart shows the difference in monthly pound returns on deposits in British pounds and German marks using forward cover from 1970 to 1995. The implied profit from arbitrage is given by (1 + iGER)FUK/GER/EUK/GER - (1 + iUK). In the 1970s, the difference was positive and often large: traders would have profited from arbitrage by moving money from pound deposits to mark deposits, but capital controls prevented them from freely doing so. After financial liberalization, these profits essentially vanished, and no arbitrage opportunities remained. The CIP condition held, aside from small deviations resulting from transactions costs and measurement errors.
Source: Maurice Obstfeld and Alan M. Taylor, 2004, Global Capital Markets: Integration, Crisis, and Growth, Japan-U.S. Center Sanwa Monographs on International Financial Markets, Cambridge: Cambridge University Press.
60. Evidence on Covered Interest Parity Are there arbitrage profits?
We observe that once capital controls were removed, arbitrage profits disappeared.
In financial systems that have become liberalized, riskless arbitrage opportunities have disappeared.
CIP holds, except for tiny spreads.
The CIP equation is used to exactly price forward contracts (if we know interest rates and E then we can solve for F):
62. Assets and their Attributes Important observations
Investors are willing to trade off among these attributes.
For example, one may be willing to accept higher risk and lower liquidity if the asset�s rate of return is higher.
Expectations matter
Most assets do not have a fixed, guaranteed rate of return.
Similarly, not all assets have fixed levels of risk and liquidity.
The expected rate of return is the forecast of the rate of return.
64. Risky Arbitrage: Uncovered Interest Parity Example: Consider investing $1 in a bank deposit in two places: New York and Europe.
In one year, you will earn a (1+i$) rate of return in dollars in the account in New York.
In one year, you will earn a (1+i�) rate of return in euros in the account in Europe.
Again we must calculate the dollar return in Europe:
Today, one U.S. dollar buys 1/ E$/� euros.
In one year, you will have (1+i�)/E$/� euros.
You do not know the E$/� spot exchange rate that will prevail in one year when you convert your euros back into U.S. dollars
This time you take the risk, and make some forecast of the expected exchange rate in one year�s time Ee$/� .
In this case, your rate of return on the European deposit would be (1+i�) Ee$/�/E$/� U.S. dollars.
There is exchange rate risk because the future spot exchange rate Ee$/� is not known when the investments are made.
65. Risky Arbitrage: Uncovered Interest Parity Figure 2.10: Arbitrage and Uncovered Interest Parity Under UIP, returns to holding dollar deposits accruing interest going along the path AB must equal the expected returns from investing in euros going along the risky path ACDB. Hence, at B, the expected payoff must be the same on both paths, and (1 + i$) = Ee$/� /E$/� (1 + i�).
$/�
Figure 2.10: Arbitrage and Uncovered Interest Parity Under UIP, returns to holding dollar deposits accruing interest going along the path AB must equal the expected returns from investing in euros going along the risky path ACDB. Hence, at B, the expected payoff must be the same on both paths, and (1 + i$) = Ee$/� /E$/� (1 + i�).
$/�
66. Risky Arbitrage: Uncovered Interest Parity Uncovered Interest Parity (UIP)
No arbitrage condition for expected returns
States that the expected returns must be equal when expressed in a common currency
We assume risk neutrality; e.g. that a risk neutral US investor does not care that the left hand side is certain, while the right hand side is risky.
67. Uncovered Interest Parity (UIP)
Knowing the expected exchange rate and the interest rates for each currency, we can solve for the spot exchange rate:
Risky Arbitrage: Uncovered Interest Parity
69. Evidence on Uncovered Interest Parity An important testable implication:
70. Evidence on Uncovered Interest Parity Plot RHS versus LHS:
UIP+CIP predicts 45 degree line.
Surveys tend to find a positive slope, close to 1.
But there is a lot of noise: traders have widely differing beliefs.
UIP finds some support in these data. Figure 2.11: Evidence on Interest Parity When UIP and CIP hold, the 12-month forward premium should equal the 12-month expected rate of depreciation. A scatterplot showing these two variables should be close to the 45-degree line. It is hard to obtain data on market expectations, but this has been attempted using evidence from surveys of individual forex traders� expectations over the period 1988 to 1993. UIP finds some support in these data, as the slope is not too far from 1.
Notes: Line of best fit is through the origin. Data shown are monthly for the German mark, Swiss franc, Japanese yen, British pound, and Canadian dollar against the U.S. dollar from February 1988 to October 1993.
Source: From Menzie Chinn and Jeffrey A. Frankel, 2002, �Survey Data on Exchange Rate Expectations: More Currencies, More Horizons, More Tests,� in W.
Allen and D. Dickinson, eds., Monetary Policy, Capital Flows and Financial Market Developments in the Era of Financial Globalisation: Essays in Honour of Max Fry, London: Routledge, 145�167.
Figure 2.11: Evidence on Interest Parity When UIP and CIP hold, the 12-month forward premium should equal the 12-month expected rate of depreciation. A scatterplot showing these two variables should be close to the 45-degree line. It is hard to obtain data on market expectations, but this has been attempted using evidence from surveys of individual forex traders� expectations over the period 1988 to 1993. UIP finds some support in these data, as the slope is not too far from 1.
Notes: Line of best fit is through the origin. Data shown are monthly for the German mark, Swiss franc, Japanese yen, British pound, and Canadian dollar against the U.S. dollar from February 1988 to October 1993.
Source: From Menzie Chinn and Jeffrey A. Frankel, 2002, �Survey Data on Exchange Rate Expectations: More Currencies, More Horizons, More Tests,� in W.
Allen and D. Dickinson, eds., Monetary Policy, Capital Flows and Financial Market Developments in the Era of Financial Globalisation: Essays in Honour of Max Fry, London: Routledge, 145�167.
72. Summary�how spot and forward rates are determined by UIP & CIP. Arbitrage and Interest Rates Figure 2.12: How Interest Parity Relationships Explain Spot and Forward Rates In the spot market, UIP provides a model of how the spot exchange rate is determined. To use UIP to find the spot rate, we need to know the expected future spot rate and the prevailing interest rates for the two currencies. In the forward market, CIP provides a model of how the forward exchange rate is determined. When we use CIP, we derive the forward rate from the current spot rate (from UIP) and the interest rates for the two currencies.
Figure 2.12: How Interest Parity Relationships Explain Spot and Forward Rates In the spot market, UIP provides a model of how the spot exchange rate is determined. To use UIP to find the spot rate, we need to know the expected future spot rate and the prevailing interest rates for the two currencies. In the forward market, CIP provides a model of how the forward exchange rate is determined. When we use CIP, we derive the forward rate from the current spot rate (from UIP) and the interest rates for the two currencies.
73. Key Points The exchange rate in a country is the price of a unit of foreign currency expressed in terms of the domestic currency.
When the exchange rate rises: foreign currency costs more, so the home currency is said to have depreciated;
When the exchange rate falls: foreign currency costs less, so the home currency is said to have appreciated
The exchange rate is used to convert the prices of goods and assets into a common currency for purposes of commensurate comparisons.
74. Key Points Exchange rates may be stable over time or they may fluctuate.
Looking across all countries today, fixed and floating rate regimes are about equally common.
Some countries suffer exchange-rate crises, where the exchange rate experiences a sudden and large depreciation.
Countries may forego a national currency
to form a currency union with other nations (e.g., the euro)
or to unilaterally adopt the currency of another country (�dollarization�).
75. Key Points The foreign exchange market is dominated by spot transactions, but many other derivative contracts exist.
The main actors in the market are private investors and (frequently) the government authorities, represented usually by the central bank.
One key to understanding the forex market is arbitrage.
Spot exchange rates move closely in line in different forex market centers because transaction costs are low.
76. Key Points Interest arbitrage leads investors to compare the return to assets in different currencies.
Covered interest parity (CIP) condition (riskless arbitrage)
Uncovered interest parity (UIP) conditions (risky arbitrage)
These conditions characterize a no-arbitrage equilibrium in the forward and spot markets.