Download

1 / 10
180 likes | 1.07k Vues
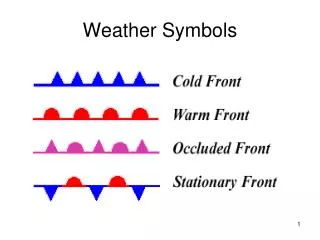
Weather Symbols. The Station Model. The weather of an individual weather station is plotted on a station model. . The value highlighted in yellow located in the upper left corner is the temperature in degrees Fahrenheit. .

E N D
The Station Model The weather of an individual weather station is plotted on a station model.
The value highlighted in yellow located in the upper left corner is the temperature in degrees Fahrenheit. Temperature: is defined as a measure of the average of the speed of the molecules in motion in the air. - fast the molecules = high temperatures - slow molecules = low temperatues
Weather Symbol The weather symbol indicates the type of weather occurring at the time the observation is taken.
Dew Point Temperature Indicates the amount of moisture in the air The higher the dew points, the higher the moisture content in the air. Dew point = the temperature to which the air would have to cool in order to reach saturation. Saturation = When the dew point temperature and air temperature are equal. You can tell if air is saturated by the formation of water droplets (drops on a glass). Dew point temperature is NEVER GREATER than the air temperature. What do you think happens when the temperature equals the dew point? Formation of droplets of water, fog, or precipitation.
Interpreting Pressure Reports: If reported value less than 500: If reported value greater than 500: Initial 10 is missing. Place it on left, then divide by 10 (add a decimal point in between the last two numbers). For example (as in above diagram): 027 becomes 1002.7 mb. Initial 9 is missing. Place it on left, then divide by 10 (add a decimal point in between the last two numbers). For example: 827 becomes 982.7 mb. Air Pressure The value highlighted in yellow represents the last three digits of the observed pressure reading in millibars (mb).
Wind barbs point in the direction "from" which the wind is blowing. In the case of the diagram to the right, the orientation of the wind barb indicates winds from the Northeast. Wind speed is given here in the units of "knots". A "Knot" is a nautical mile per hour. 1 Knot = 1.15 Miles Per Hour (MPH) 1 Knot = 1.9 Kilometers Per Hour (KM/HR) Each short barb represents 5 knots, each long barb 10 knots. A long barb and a short barb is 15 knots, simply by adding the value of each barb together (10 knots + 5 knots = 15 knots). If only a station circle is plotted, the winds are calm.