Sample Work for Parametric AND Non- Parametric Test| Statswork
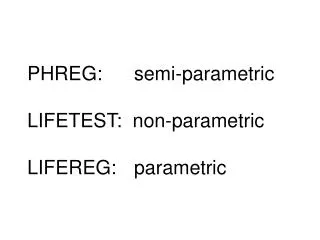
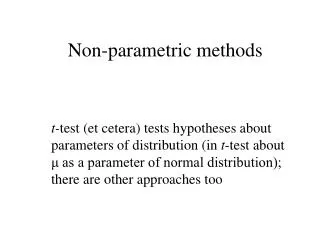
Statistical tests can be split into two categories.<br>(i) Parametric tests<br>(ii) Non-parametric tests.<br><br> Parametric tests<br>(i) Test for Normality<br>Every data must follow certain distribution. But we have to find the appropriate distribution<br>from goodness of fit test. So, our data is checked through each and every distribution. Hence,<br>goodness of fit test is very tedious. This way of estimation of data is called by parametric tests.<br>Parametric tests always give the reliable estimated value.<br><br> List of parametric tests and their usage?<br>Independent sample t test – Compare means between two groups<br>Paired sample t test – Compare means between related groups<br>ANOVA – Compare the means between two or more distinct groups<br>Pearson correlation coefficient – Relationship between two variables.<br><br> Non-parametric tests:<br> <br>List of non-parametric tests and their usage?<br>Mann-Whitney U test – Compare mean rank between two groups<br>Friedman test – Compare mean rank between three or more related groups<br>Kruskal-Wallis test – Compare the mean rank between two or more distinct groups<br>Spearman’s rank correlation – Relationship between two variables.<br><br>Our Quality: <br>We offer three tier quality check process.<br>• Subject Matter expertise<br>• Quality Check<br>• Quality Assurance<br><br>Contact Us:<br>UK NO: 44-1143520021<br>India No: 91-8754446690<br>US NO: 1-972-502-9262<br>Email: info@statswork.com<br> Website: http://www.statswork.com/


Sample Work for Parametric AND Non- Parametric Test| Statswork
E N D
Presentation Transcript
PARAMETRIC AND NON- PARAMETRIC TEST DataAnalysis © 2017-2018 All Rights Reserved, No part of this document should be modifed/used without prior consent Statswork™ - Your trusted mentor since 2001 I www.statswork.com UK: The Portergate, Ecclesall Road, Shefeld, S11 8NX I UK # +44-1143520021, Info@statswork.com www.statswork.com
DataAnalysis Statistical tests can be split into two categories. (i) Parametric tests (ii) Non-parametric tests. Parametric tests (i) Test for Normality Every data must follow certain distribution. But we have to find the appropriate distribution from goodness of fit test. So, our data is checked through each and every distribution. Hence, goodness of fit test is very tedious. This way of estimation of data is called by parametric tests. Parametric tests always give the reliable estimated value. If the data follow the normal distribution, then we can use parametric statistical tests. According to the central limit theorem, if the sample size is large, all data must follow the normal distribution. List of parametric tests and their usage? ?Independent sample t test – Compare means between two groups ?Paired sample t test – Compare means between related groups ?ANOVA – Compare the means between two or more distinct groups ?Pearson correlation coefficient – Relationship between two variables. Independent sample t-test Independent sample t test is used to find out whether the mean of two unrelated groups (independent variable) are equal or not based on the same dependent variable. The data should be in the following format. 1 © 2017-2018 All Rights Reserved, No part of this document should be modifed/used without prior consent Statswork™ - Your trusted mentor since 2001 I www.statswork.com UK: The Portergate, Ecclesall Road, Shefeld, S11 8NX I UK # +44-1143520021, Info@statswork.com www.statswork.com
DataAnalysis The data should contain without outliers. Outlier means a value(s) which is deviate from the whole data. The data should follow approximately normally distributed for each of the group of independent variable. The variability within the independent variable is not distinct. What are the values are extracting from this test and their usage? F-value and p-value for Levene’s test are used to test the homogeneity of variances -value must be greater than 0.05, then . Sample work Table 1: Comparison of Mean Spherical equivalent of the amblyopic and non-amblyopic eyes for different groups Refractive Error (D) Groups Mean±SD P value Normal Amblyopic Hyperopic Anisometropia 0.7±1.4 3.9±1.8 0.000** Myopic Anisometropia -0.8±1.3 -3.3±1.4 0.000** Sensory -0.0±0.8 0.0±1.6 0.866 Strabismus -0.1±1.3 -0.5±1.9 0.551 SD- Standard deviation ** denotes P<0.01; * P<0.05 Table 1 presents the mean spherical equivalent of the amblyopic and non-amblyopic eyes uivalent is 2 © 2017-2018 All Rights Reserved, No part of this document should be modifed/used without prior consent Statswork™ - Your trusted mentor since 2001 I www.statswork.com www.statswork.com
DataAnalysis spherical equivalent (-0.8±1.3) (P=0.00). There is no statistically significant difference in the mean spherical equivalent for sensory and Strabismus Amblyopia and their fellow eye. Oneway-ANOVA dependent variable. The data should satisfy the following conditions: ?Independent variable must be in categorical data ?Dependent variable should be measured on a continuous scale (interval or ratio) ?The data should contain without outliers. Outlier means a value(s) which is deviate from the whole data. ?The data should follow approximately normally distributed for each of the group of independent variable. ?The variability within the independent variable is not distinct. What are the values are extracting from this test and their usage? ?Descriptive statistic (Mean, SD and SE) for groups based on the dependent variable. ?F-value and p-value are used to compare the mean values between the groups of independent variable. ?Multiple comparison tests give the information about whether combinations of two groups’ means are equal. Sample Work Table 2: Difference in mean score between different methods New method (n=49) Mean±SD Standard method (n=48) Control (n=48) F-value p-value 3 © 2017-2018 All Rights Reserved, No part of this document should be modifed/used without prior consent Statswork™ - Your trusted mentor since 2001 I www.statswork.com www.statswork.com
DataAnalysis Table 2 reveals the difference in mean scores between different methods was analyzed Paired sample t test Paired sample t test is used to find out whether the mean of two related groups (independent variable) are equal or not based on the same dependent variable. Here related group data means data is gathered from same participants, but different time period. The data should be in the following format. ?Independent variable must be in categorical data ?Dependent variable should be measured on a continuous scale (interval or ratio) ?The data should contain without outlier. Outlier means a value which is deviate from the whole data. ?The distribution of the difference in the dependent variable between two related groups should be approximately normal distribution. What are the values are extracting from this test and their usage? ?Descriptive statistic (Mean, SD and SE) for two groups based on the dependent variable. ?tvalue and p-value for t test are used for compare the mean of two related groups based on dependent variable. Table 3: Paired t-test analysis for experimental group and control group to Subject-verb- object Mean Difference (MD) -0.03 Group Baseline test Mean Score t-test p- value Experimental 0.1 0.13 -3.2 0.016* Control 0.1 1 -0.9 -1.9 0.058 *Experimental =Song teaching method; control=standard teaching method, p<0.05 Table 3 presents a comparison of the subject verb object scores of the students who have been given song and standard as a method of teaching. The results revealed that the baseline scores (M=0.1) was significantly improved after song (M=0.1) as a method of teaching with a 4 © 2017-2018 All Rights Reserved, No part of this document should be modifed/used without prior consent Statswork™ - Your trusted mentor since 2001 I www.statswork.com www.statswork.com
DataAnalysis mean difference value (-0.03, p=0.016). However, the control groups although showed significant the effect was lower than the song method of teaching (Baseline=0.1; M=1; MD=-0.9, p=0.058). Non-parametric tests List of non-parametric tests and their usage? ?Mann-Whitney U test – Compare mean rank between two groups ?Friedman test – Compare mean rank between three or more related groups ?Kruskal-Wallis test – Compare the mean rank between two or more distinct groups ?Spearman’s rank correlation – Relationship between two variables. Friedman test Table 4: Friedman test for engage bank offers via social media or net-working sites Ranks Alert me about new products relevant to my needs Notify about promotional offers or discounts Offer faster customer service Let me read customer reviews and product rankings Reward me for recommending the brand Post educational information about personal finance Let me post opinion on current products/services Invite me to submit ideas for new product/service and acknowledge /reward me as a valued contributor Mean Rank 4.53 4.58 5.37 4.49 4.43 4.44 4.09 4.07 P-value= 0.000 Friedman test was applied to identify engage bank offers via social media or net-working sites. Table 4 presents the findings of Friedman tests, which ranks bank offers via social media or net- working sites as recorded by survey participants. It is observed that ‘Offer faster customer acknowledge /reward me as a valued contributor’ of 4.07. While, the difference between these 5 © 2017-2018 All Rights Reserved, No part of this document should be modifed/used without prior consent Statswork™ - Your trusted mentor since 2001 I www.statswork.com www.statswork.com
DataAnalysis factors is significant, at p=0.000. Hence, it can be concluded that there is significant difference within the mean rank. Mann-Whitney U test Table 5: Comparison of % of fatty acid and gender Female Male Total 10 10 20 10.40 10.60 0.940 (NS) % of FA in terms of total FA 49.00 NS- Not Significant Table 5 presents the difference in the mean of fatty acid between male and female. The obtained p-value for the % of FA in terms of total fatty acid is 0.940 which is greater than 0.05. Hence there is no statistically significant difference in the mean rank between male and female. Kruskal Wallis Test Table 6: Kruskal Wallis test engage bank offers via social media or net-working sites for different segments Ranks P-value Segment Professionals Student/Young professionals Homemaker Total Professionals Student/Young professionals Homemaker Total Professionals Student/Young professionals Homemaker N 65 51 36 152 65 51 36 152 65 51 36 Mean Rank 79.03 66.99 85.40 Alert me about new products relevant to my needs 0.126 71.81 80.14 79.82 Notify about promotional offers or discounts 0.517 78.01 77.24 72.74 Offer faster customer service 0.832 6 © 2017-2018 All Rights Reserved, No part of this document should be modifed/used without prior consent Statswork™ - Your trusted mentor since 2001 I www.statswork.com www.statswork.com
DataAnalysis Homemaker Total Professionals 36 152 65 88.22 69.26 Professionals Student/Young professionals Homemaker Total Professionals Student/Young professionals Homemaker Total Professionals Student/Young professionals Homemaker Total 65 51 36 152 65 51 36 152 65 51 36 152 74.62 77.79 78.07 Post educational information about personal finance 0.899 80.98 74.01 71.93 Let me post opinion on current products/services 0.535 74.98 76.84 78.76 Invite me to submit ideas for new product/service and acknowledge /reward me as a valued contributor 0.914 The Kruskal-Wallis H test (sometimes also called the "one-way ANOVA on ranks") is a rank- based nonparametric test that can be used to determine if there are statistically significant differences between two or more groups of an independent variable on a continuous or ordinal dependent variable. It is considered the nonparametric alternative to the one-way ANOVA, and an extension of the Mann-Whitney U test to allow the comparison of more than two independent groups. The mean rank (i.e., the "Mean Rank" column in the Ranks table) can be used to compare with different segments. A Kruskal-Wallis H test showed that there is no significant difference in the mean rank since (P>0.05). Table 6. 7 © 2017-2018 All Rights Reserved, No part of this document should be modifed/used without prior consent Statswork™ - Your trusted mentor since 2001 I www.statswork.com www.statswork.com