Download
1 / 20
200 likes | 219 Vues
Major driving factor for the growth of biofuels market is the environmental concerns that are causing the limitation over the use of non-renewable fuels such as petrol and diesel. According to Goldstein Research, Biofuel Industry is expected to reach more than USD 246.52 billion by 2024 from USD 168.18billion in 2016, growing at a compounded annual growth rate of 4.92% over the forecast period 2016-2024

E N D
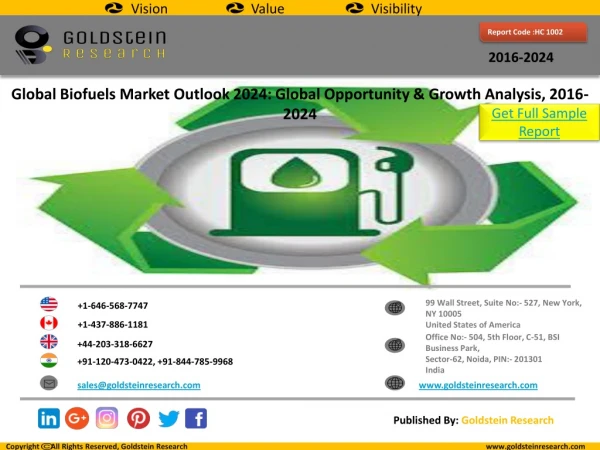
Vision Value Visibility Report Code :HC 1002 2016-2024 Global Biofuels Market Outlook 2024: Global Opportunity & Growth Analysis, 2016- 2024 Get Full Sample Report 99 Wall Street, Suite No:- 527, New York, NY 10005 United States of America Office No:- 504, 5th Floor, C-51, BSI Business Park, Sector-62, Noida, PIN:- 201301 India +1-646-568-7747 +1-437-886-1181 +44-203-318-6627 +91-120-473-0422, +91-844-785-9968 www.goldsteinresearch.com sales@goldsteinresearch.com Published By: Goldstein Research Copyright All Rights Reserved, Goldstein Research www.goldsteinresearch.com
1. Executive Summary Fig: 1-2 Global Biofuels Market Share(%), By Region-2016-2024 Fig: 1-1 Global Biofuels Market Size USD (Billion). 2016-2024 XX% CAGR: (2016-2024) XX% Get Full Sample XX% XX% XX% 2024 Report XX% XX% 2016 XX% XX% XX% XX% 2016e 2017e 2018f 2019f 2020f 2021f 2022f 2023f 2024f North America Asia-Pacific Latin America Europe Middle East & Africa Source: Goldstein Research Source: Goldstein Research In 2016,Bio Ethanol accounted for the highest market share XX% in Biofuels Market WithXX%share in 2016, Asia Pacific region dominated the collective Global Biofuels market Fig: 1-3 Global Biofuels Market Share(%), By Product Type-2016 Fig: 1-4 Global Biofuels Market Share(%), By Form of Biofuel-2016 Fig: 1-5 Top Countries with Highest CO2 Emission, 2016 Bio-Ethanol Highest Rates XX% XX% XX% China Bio-Diesel XX% XX% Liquid Biofuel U.S.A. XX% Bio-Methnol Gaseous Biofuel India Solid fuel Bio-Hydrogen Russia XX% XX% Pallets Japan Source: Goldstein Research Source: Goldstein Research Source: Goldstein Research Copyright All Rights Reserved, Goldstein Research www.goldsteinresearch.com
Key Findings Get Full Sample Report The global Biofuels market accounted for USD XX billion in 2016 and tends to reach the valuation of USD XX billion by 2024 at a CAGR of XX% over the forecast years owing to the fact that combination of government policy initiatives and increasing oil prices have been pushing the growth of biofuel market. Commercial production of 2nd generation bioethanol from lingo-cellulosic materials that is expected to supplement the annual supply of XX billion gallons of 1st Generation bioethanol. It is expected that global bioethanol production and utilization will increase significantly in the near future from XX billion gallons in 2016 to XX billion gallons by 2024. Regions with high energy consumption such as Europe and North America and regions with high energy production such as Brazil, Indonesia are witnessed in phenomenon of biofuels production of XX% of the total global biofuel production. Biofuels such as diesel, ethanol and wood can be produces from existing technologies. The new trend is named as 2nd generation biofuels which are specifically made from biomass such as lingo cellulosic feedstock to convert enzymes into fuels. Renewable energy supply globally was XX TWh in 2016 which has increased by XX% since 2014. Among the consumption of renewable energy, electricity has the largest share of among all other sectors. Though biomass is 3rd largest source of generating electricity, however solar and wind energy are the fastest growing sectors with annual growth rate of XX%. Rising CO2 levels Cost Effective Technological Advancements Feedstock Asia-Pacific & Latin America Biofuels Market (USD Billion) Asia-Pacific Latin America Non-Renewable Energy XX Billion XX Billion 2016 XX Billion XX Billion 2024 Copyright All Rights Reserved, Goldstein Research www.goldsteinresearch.com
Global Country Biofuel Production, 2016-2024 Get Full Sample Report Biofuel Production in 2016 (in Metric tons) Biofuel Production in 2024 (in Metric tons) Country U.S.A. XX XX Brazil XX XX Germany XX XX Argentina XX XX Japan XX XX France XX XX China XX XX U.K. XX XX Australia XX XX India XX XX Copyright All Rights Reserved, Goldstein Research www.goldsteinresearch.com
Global Biofuel Market Overview Fig:- Global Raw Material share for Biodiesel Production Fig:- Global Renewable Energy Supply Region Wise Get Full Sample Report XX Edible Plant Oils XX Hydro2 XX Wind XX Solar Thermal Non-Edible Plant Oils XX Animal Fats Solar PV Raw Material XX Geothermal XX Hydro XX Biomass XX total Used Edible Oils Microalgae XX Africa America Asia Europe Oceania World Fig:- Global Energy Supply – 2016 Fig:- Global Primary Energy Supply For all Renewables-2016 2016 XX% XX% XX% XX% XX% Biomass Nuclear XX% XX% Renewables Hydro XX% Coal Geothermal Oil Solar PV Natural Gas XX% XX% Solar Thermal XX% Wind Copyright All Rights Reserved, Goldstein Research www.goldsteinresearch.com
2. Research Methodology Goldstein Research follows a comprehensive and rigorous research methodology to provide you accurate estimates and forecast of a particular market. We provide estimates, forecast and analysis primarily based on secondary research, primary interviews, in-house database and other free as well paid sources. Our company follows simultaneous top down and bottom approach in order to provide you the accurate market sizing. Data triangulation method is strictly followed where we triangulate the data from all the aspects, be it Function Type, application, industry verticals, material, product type or geography. In addition, the research methodology we follow is a systematic approach in order to estimate and project the market sizing keeping in mind all the on-going and upcoming trends of the market. We conduct both primary and secondary research in order to estimate a market and validate our key findings. We put together our effort and prepare an inclusive questionnaire depending on the title of the market we are tracking and extract the important information we require to validate our findings. Our team of Analysts and experts dedicatedly put their effort to provide you the best possible and accurate data and analysis. Adding to that; technological, economic, cultural and social aspects along with the regulatory barriers are completely analysed to understand the comprehensive market scenario across different geographies. Understanding the market from both buyer and seller point of view is important to track a market and provide analysis on the same. We not only provide the market data of the four geographies as a whole, namely, North America, Europe, Asia- Pacific, Latin America, Middle East & Africa and Rest of the World (RoW) but we also provide you qualitative as well we qualitative information on country level bifurcation. We at Goldstein Research provide you: • Precise Estimates and Forecast • Authentic Analysis • In-depth Data and Analysis • Authentic Sources • Reliable Data and Analysis Get Full Sample Report Copyright All Rights Reserved, Goldstein Research www.goldsteinresearch.com
6.1. Global Biofuel Market Share(%) - By Product Type,2016-2024 Get Full Sample Report Key Findings Fig: 6-1 Global Biofuel Market Share, By Product Type, 2016-2024 U.S.A. Biofuel market valued USD XX billion in 2016 and tends to reach the value of USD XX billion by 2024 at a considerable CAGR over the forecast period The top 10 countries with high biomass resources supply includes mainly the Asian countries but USA, Brazil and Canada are exception in this list. Bioethanol and biodiesel are the major biofuels that use the XX% of agricultural feedstock compared to other raw material sources. Biofuel production covers 2.9% of the land area used for production of major biofuel crops Most of the biofuels produced was from bioethanol produced from fermentation of sugar based crops. Rest from biodiesel via trans-esterification of vegetable oils and animal fats. Bio-Ethanol XX% XX% XX% XX% Bio-Diesel XX% XX% XX% 2024 2016 XX% Bio-Methnol XX% Bio-Hydrogen XX% Pallets Source: Goldstein Research Fig: 7-4 Global Biofuel Market Size (USD Billion), By Product Type-2016- 2024 Fig: 6-3 Global Biofuel Market Y-O-Y Growth, By Type, 2016-2024 XX XX XX XX XX XX XX XX XX XX 2016 2024 2015 2016e 2017f 2018f 2019f 2020f 2021f 2022f 2023f Bio-Ethanol Bio-Diesel Bio-Methnol Bio-Hydrogen Pallets Y-o-Y Source: Goldstein Research Source: Goldstein Research Copyright All Rights Reserved, Goldstein Research www.goldsteinresearch.com
4. Global Biofuels Market Size (USD Billion) & Growth Analysis Fig:- 4-1 Global Biofuels Market Size (USD Billion)-2016-2024 Fig:- 4-2 Global Biofuels Market Y-O-Y Growth (%) Analysis-2016-2024 XX% XX XX Get Full Sample Report XX% XX XX XX% XX XX% XX XX XX% XX% XX XX XX% XX% XX% XX% XX% XX% XX XX XX% XX% XX% XX% XX XX XX% XX XX% XX XX XX XX% XX XX XX% XX XX% XX 2015 2016 2017 2018 2019 2020 2021 2022 2023 2024 2015 2016 2017 2018 2019 2020 2021 2022 2023 2024 Source: Goldstein Research Source: Goldstein Research Global Biofuels market tends to increase at a CAGR of XX% and reach the market value of USD XX billion by 2024. Biofuels are used predominantly for road transport i.e. XX% of road transport sector and options are also available for marine and aviation sectors as well. Global production of biofuels produced XX million tones of protein production, a major source of feed. Other biofuel sectors with rapid growth or volumes are biogas, pellets and charcoal. Biogas production reached XX billion Nm3 with an average growth rate of XX%. Almost half of the biogas production occurs in Europe. Globally XX billion liters of biofuels are produced annually with an annual growth rate of XX% which is lot more higher than biomass supply at XX% Copyright All Rights Reserved, Goldstein Research www.goldsteinresearch.com
4.1. Global Biofuels Market Overview, By Region and Market Players-2016 Fig:- 4-3 Global Biofuels Market Share (%), By Country, 2016 Fig:- 4-4 Global Biofuels Market Share (%), By Players, 2016 XX% XX% United States of America BlueFire Renewables Get Full Sample Report XX% XX% XX% XX% XX% Chief Industries Inc. Brazil XX% XX% Bio Amber Germany XX% Cosan XX% XX% Argentina Gevo XX% XX% Coskata Indonesia Sapphire Energy France XX% Genomatica XX% XX% China XX% Green Biologics Netherlands Others Source: Goldstein Research Source: Goldstein Research Global Biofuels market accounted USD XX billion in 2016 on the back of the policies on energy independence and climate change have encouraged development and utilization of renewable energy in the form of bioenergy and biofuels. China has the largest urban population of XX million people with USD XX billion GDP. China has highest CO2 emissions and requires XX PJ renewable energy supply compared to other regions. The source of raw material through forestry and agricultural produce in China is sufficient for the production of biofuels. Copyright All Rights Reserved, Goldstein Research www.goldsteinresearch.com
5.1. Growth Drivers Global Non-Renewable Energy Generation by Siurces Increasing Use of Non-Renewable Resources Driving The Biofuels Market In the year 2016 non-renewable energy production has increased by XX% in 2016 from XX TWh. The use of Microalgae is the new trend of producing biofuels to avoid the utilization of food resources for energy production. Pellets are formed by compressing original materials has high density and energy content per unit volume compared to unprocessed biomass, useful for long distance transportation. Various technologies have been developed to enable co-firing of biomass with coal such as Utilizing biomass in an existing thermal power plant can be accomplished through direct or indirect co-firing. Get Full Sample Report XX% XX% Coal/Peat XX% Natural Gas XX% Hydro Nuclear XX% Oil Others XX% Impact Analysis:- Biofuels improvements in crop production and processing efficiencies and that the volume of biofuels produced in 20169 in a specific planted area is several times higher than it used to be a decade ago. Improved production methods and technologies are expected to increase these efficiencies even further. Customers have realized the importance of cycle efficiency, safety and wastage reduction, resulting into more acceptance of the bio based products such as biofuels. producers have achieved significant Petroleum Liquid Fuel Consumption of Major Regions 2016-2024 XX XX 2016 2024 XX XX XX XX China India Middle East USA Europe Japan High Medium Low Impact on Biofuels Market Copyright All Rights Reserved, Goldstein Research www.goldsteinresearch.com
5.3.1. Market Restraints Top 5 Countries Expenditure on Biofuel Production Complication in Adapting Biofuels Some government pose restrictions on biofuel production or import due to the type of raw material being used such as government of Poland announced a law against certain imported biofuels and raw materials for biofuel. There is strict parameters for using agricultural and forestry produce as this hampers the food security initiatives in a economy. The commercial viability of the biofuels is very important in order to replace the existing fuels made from non-renewable sources XX XX XX XX XX XX XX XX XX XX XX XX XX USA Brazil China India France Electricity Generation Through Various Sources Get Full Sample Report Source: National Center for Biotechnology Information Impact Analysis:- Recent concerns arise that biofuel production competes with food production. the demand for biomass increases, the production of biofuels will not only compete with the food sector, but also with chemical industries and regenerative raw materials. The share of total road-transport fuel is not expected to surpass X% by 2030. Thus biofuels production costs still remain comparatively high and substantial cost reductions are required for cost types to become commercially competitive. XX% Hydro XX% Geothermal Solar PV XX% XX% Solar Thermal XX% Wind Biomass XX% High Medium Low Source: National Center for Biotechnology Information Impact on Biofuels Market Copyright All Rights Reserved, Goldstein Research www.goldsteinresearch.com
6.1(a). Global Revenue (USD Billion) of Biofuels, By Form of Biofuel, 2016-2024 Form of Biofuel/Year 2016 2017 2018 2019 2020 2021 2022 2023 2024 CAGR % Liquid Biofuel XX% XX XX XX XX XX XX XX XX XX Gaseous Biofuel XX% XX XX XX XX XX XX XX XX XX Solid Biofuel XX% XX XX XX XX XX XX XX XX XX Get Full Sample Report Liquid Biofuel Production Globally, 2016-2024 XX XX XX Advanced Biofuel Biodiesel XX Bioethanol XX XX 2016 2017 2018 2019 2020 2021 2022 2023 2024 Source: Goldstein Research Copyright All Rights Reserved, Goldstein Research www.goldsteinresearch.com
6.1.1. Global Bioethanol Market, 2016-2024 Fig:- 6-4 Global Bioethanol Market Size (USD Billion)-2016-2024 Fig:- 6-5 Global Bioethanol Market Y-O-Y Growth (%) Analysis-2016-2024 XX% XX XX Get Full Sample Report XX% XX XX XX% XX XX% XX XX XX% XX% XX XX XX% XX% XX% XX% XX% XX% XX XX XX% XX% XX% XX% XX XX XX% XX XX% XX XX XX XX% XX XX XX% XX XX% XX 2015 2016 2017 2018 2019 2020 2021 2022 2023 2024 2015 2016 2017 2018 2019 2020 2021 2022 2023 2024 Source: Goldstein Research Source: Goldstein Research Fig:- 6-6 Global Share of Biofuels in major crop production, 2016 XX% XX% Global Bioethanol market was USD XX billion in 2016, expected to attain the growth rate of XX% over the forecast period and reach USD XX Billion by 2024. Asia-Pacific Bioethanol market dominate owing to the largest economies having feedstock available closely followed by North America with XX% market share in bioethanol. Wheat XX% XX% XX% XX% Maize Other Grains Sugarbeet Sugarcane Palm oil Vegetable Oil XX% Source: Goldstein Research Copyright All Rights Reserved, Goldstein Research www.goldsteinresearch.com
6.3. Global Biofuels Market Attractiveness and BPS Analysis by Product Type, 2016-2024 Fig: 6-7 Global Biofuels Market Attractiveness-By Product Type, 2016- 2024 Fig: 6-8 Global Biofuels Market BPS Analysis- By Product Type, 2016-2024 XX XX% Get Full Sample Report XX% XX XX XX% XX% XX XX XX% XX XX XX XX% XX XX XX XX XX XX XX% XX% XX XX XX XX XX XX XX XX XX XX XX Bio-Ethanol Bio-Hydrogen Bio-Methanol 2016 2024 Bio-Diesel Pallets Bio-Ethanol Bio-Diesel Bio-Methnol Bio-Hydrogen Pallets Source: Goldstein Research Source: Goldstein Research According to Goldstein Research, Bioethanol holds largest market owing to its easier production and availability of raw material as compared to other biofuels. Biodiesel tends to capture the large market share in the near future on the expense of bio methanol and bio hydrogen on account of increasing requirement of the biodiesel for the functioning of the economy. Pellets have high usability for long route transportation hence its market share is also expected to increase in future. Copyright All Rights Reserved, Goldstein Research www.goldsteinresearch.com
6.4. Global Biofuels Market Share (%), 2016 & Market Size (USD Billion), By Region,2015 & 2016 Fig: 6-9 Global Biofuels Market Share (%) - By Region, 2016 Fig: 6-10 Global Biofuels Market Size (USD Billion) - By Region, 2015-2016 XX Get Full Sample Report XX XX% XX XX XX% XX% XX 2015 2016 XX XX XX XX% XX XX XX% XX XX XX XX XX North America Latin America Middle East & Africa Asia-Pacific Europe XX North America APAC Latin America Europe Middle East & Africa Source: Goldstein Research Source: Goldstein Research Asia-Pacific is expected to dominate the Biofuels market with a market share of XX% by the end of the forecast period i.e. 2024 owing to the presence of high energy consumption and availability of feedstock such sugarcane, rice, corn and others. Latin America Biofuels market is anticipated to expand at a CAGR of XX% during the forecast period i.e. 2016-2024. The production capacity is expected to increase in Brazil and Argentina due to huge sugarcane production, share of which is used for producing bio-ethanol and the new technology adopted is expected to increase the bio-ethanol production by XX% by 2024. Copyright All Rights Reserved, Goldstein Research www.goldsteinresearch.com
6.4.1. Asia-Pacific Biofuels Market Size (USD Billion) & Y-O-Y growth (%),2016- 2024 Fig: 6-12 Asia-Pacific Biofuels Market Share By Product Type, 2016- 2024 Fig: 6-11 Asia-Pacific Biofuels Market Size(USD Billion)-2016-2024 Get Full Sample Report XX XX XX% XX CAGR: (2016-2024) XX Bio-Ethanol XX% XX XX% XX XX% XX XX% XX XX% Bio-Diesel XX XX% XX% Bio-Methnol XX% XX% XX% Bio-Hydrogen Pallets 2015e Source: Goldstein Research 2016f 2017f 2018f 2019f 2020f 2021f 2022f 2023f Source: Goldstein Research Fig: 6-14 Asia-Pacific Biofuels Market Size By Product Type -2016- 2024 Fig: 6-13 Asia-Pacific Biofuels Market Size (USD Millions), By Country-2016-2024 XX% XX XX XX% XX XX% XX XX XX XX% XX XX XX XX 2016 2024 2016 2023 Bio-Ethanol Bio-Diesel Bio-Methnol Bio-Hydrogen Pallets China India Source: Goldstein Research Source: Goldstein Research Copyright All Rights Reserved, Goldstein Research www.goldsteinresearch.com
6.4.1.1. China Biofuels Market Size (USD Billion) & Y-O-Y growth (%), 2016-2024 Fig: 6-15 Japan Biofuels Market Size (USD Billion). 2016-2024 Fig: 6-16 Japan Biofuels Market Y-O-Y Growth Rate, 2016-2024 Get Full Sample Report XX XX% XX XX% XX% XX% XX% CAGR: (2016-2024) XX% XX% XX% XX% XX% XX XX XX XX XX XX 2016f 2017f 2018f 2019f 2020f 2021f 2022f 2023f 2015 2016e 2017f 2018f 2019f 2020f 2021f 2022f 2023f Y-o-Y Source: Goldstein Research Source: Goldstein Research China Biofuels market tends to reach the valuation of USD XX billion by 2024 at a growing CAGR of XX% over the forecast year owing to the high consumption of energy supply and to curb the rising CO2 emissions.. In China primary forestry area decreased while planted forests has seen an annual growth of XX% to reach XX million ha by 2024.China , Russia and UK have the largest generation of derived heat from renewables. China is the top renewable electricity generating nation generated XX TWh out of which more than 80% of renewable electricity comes from Hydropower. In comparison, EU generated XX TWh of renewable electricity with a more diversified electricity mix with a combination of biomass (20%), hydropower (43%), wind (27%) and other renewable electricity sources. Thus China is now also shifting its capacities towards biomass. Copyright All Rights Reserved, Goldstein Research www.goldsteinresearch.com
COSAN (Revenue & Financial Analysis) Get Full Sample Report COSAN- Revenue (USD Million), 2014-2016 Key Takeaways Fuel distribution market in 2015 grew by XX% as a proportion of Brazilian GDP, and with an improvement competitiveness of ethanol, due to record levels of sugarcane milling. in the XX XX Revenue (USD Billion) The sectors in which it operates– sugar- energy and fuel distribution and sales – has been experiencing production and sales volumes over the last few years. XX growth in In 2016, the total cost of goods sold(COGS) amounted to USD XX billion, up XX% compared to 2015. This increase is in line with the growth in sales volume and is also the result of Petrobras diesel and gasoline price increases 2014 2015 2016 Source: Annual Report Key Financials 2015 2016 Operating Margin XX% XX% Net Profit Margin XX% XX% Debt to Asset XX XX Market Capitalization USD XX Billion USD XX Billion Copyright All Rights Reserved, Goldstein Research www.goldsteinresearch.com
COSAN ( Revenue Split & Recent News) COSAN Revenue (%)-By Business Segment, 2016 COSAN Revenue (%)-By Geography, 2016 Get Full Sample Report XX% XX% Norrth America Middle East XX% Energy Logistics Asia-Pacific XX% Latin America XX% Europe XX% XX% Source: Annual Report Source: Annual Report Recent News & Developments June, 2017: On June 17, 2017 Raízen Energia SA, the world’s largest sugar maker won a judicial auction for two sugar mills owned by Tonon Bioenergia SA, after its bid of USD XX million. March, 2016: On march 1, 2016 Sumitomo invests in Cosan’s sugarcane pellet business by acquiring up to 20 percent of Cosan Biomassa S.A. June, 2011: On June 2, 2011: Brazilian sugar-and-ethanol group Cosan Industria e Comercio SA and Royal Dutch Shell PLC announced formal creation of their Brazilian ethanol joint venture Raizen, to make it world's largest sugar-and-ethanol producer. Copyright All Rights Reserved, Goldstein Research www.goldsteinresearch.com
Get Full Sample Report Thank you Thank you Connect With Us: Published By: Goldstein Research Copyright All Rights Reserved, Goldstein Research www.goldsteinresearch.com