Download
1 / 13
130 likes | 158 Vues
Aim of this study was to investigate the use of unmodified and carbonized Sorghum Hull (CUSH 150µm and 250µm)<br>in the removal of Nickel (II) ion from aqueous solution. The effect of contact time was investigated and reported.<br>The maximum adsorption for 150µm and 250µm were at 40thand 60thminutes respectively (38.254mg/l and<br>38.545mg/l). Both pore sizes showed peak adsorption of Ni2 at different adsorption time respectively. Kinetic<br>modelling of the results of Ni2 of both pore sizes were also investigated. These results showed that Pseudo second<br>order kinetic model best describes the process and the Mechanism of adsorption show that both 150µm and 250µm<br>were film diffusion controlled. This will serve as parameters to consider in the design of treatment plants for heavy<br>metal detoxification using biosorbents of different pore sizes.

E N D
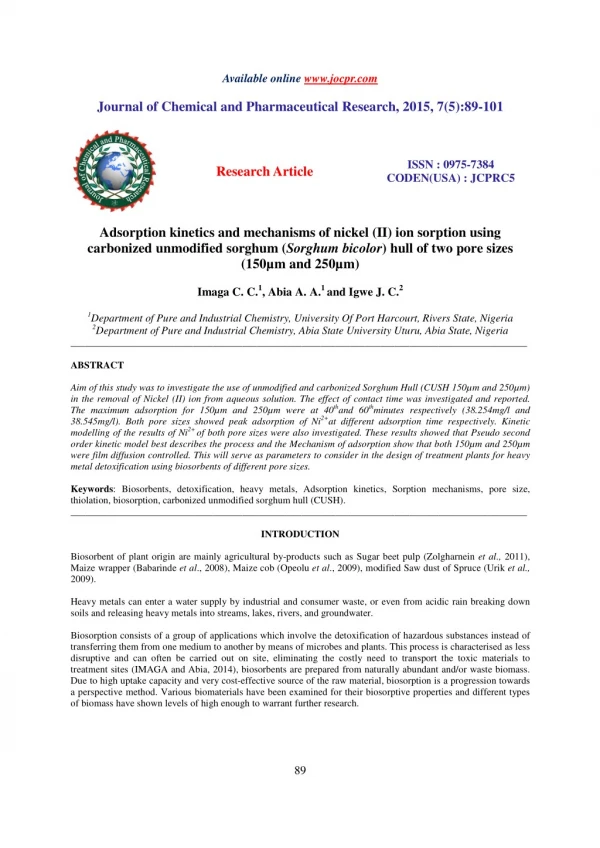
Available online www.jocpr.com Journal of Chemical and Pharmaceutical Research, 2015, 7(5):89-101 ISSN : 0975-7384 CODEN(USA) : JCPRC5 Research Article Adsorption kinetics and mechanisms of nickel (II) ion sorption using carbonized unmodified sorghum (Sorghum bicolor) hull of two pore sizes (150µm and 250µm) Imaga C. C.1, Abia A. A.1 and Igwe J. C.2 1Department of Pure and Industrial Chemistry, University Of Port Harcourt, Rivers State, Nigeria 2Department of Pure and Industrial Chemistry, Abia State University Uturu, Abia State, Nigeria _____________________________________________________________________________________________ ABSTRACT Aim of this study was to investigate the use of unmodified and carbonized Sorghum Hull (CUSH 150µm and 250µm) in the removal of Nickel (II) ion from aqueous solution. The effect of contact time was investigated and reported. The maximum adsorption for 150µm and 250µm were at 40thand 60thminutes respectively (38.254mg/l and 38.545mg/l). Both pore sizes showed peak adsorption of Ni2+at different adsorption time respectively. Kinetic modelling of the results of Ni2+ of both pore sizes were also investigated. These results showed that Pseudo second order kinetic model best describes the process and the Mechanism of adsorption show that both 150µm and 250µm were film diffusion controlled. This will serve as parameters to consider in the design of treatment plants for heavy metal detoxification using biosorbents of different pore sizes. Keywords: Biosorbents, detoxification, heavy metals, Adsorption kinetics, Sorption mechanisms, pore size, thiolation, biosorption, carbonized unmodified sorghum hull (CUSH). _____________________________________________________________________________________________ INTRODUCTION Biosorbent of plant origin are mainly agricultural by-products such as Sugar beet pulp (Zolgharnein et al., 2011), Maize wrapper (Babarinde et al., 2008), Maize cob (Opeolu et al., 2009), modified Saw dust of Spruce (Urik et al., 2009). Heavy metals can enter a water supply by industrial and consumer waste, or even from acidic rain breaking down soils and releasing heavy metals into streams, lakes, rivers, and groundwater. Biosorption consists of a group of applications which involve the detoxification of hazardous substances instead of transferring them from one medium to another by means of microbes and plants. This process is characterised as less disruptive and can often be carried out on site, eliminating the costly need to transport the toxic materials to treatment sites (IMAGA and Abia, 2014), biosorbents are prepared from naturally abundant and/or waste biomass. Due to high uptake capacity and very cost-effective source of the raw material, biosorption is a progression towards a perspective method. Various biomaterials have been examined for their biosorptive properties and different types of biomass have shown levels of high enough to warrant further research. 89
Imaga C. C. et al ______________________________________________________________________________ J. Chem. Pharm. Res., 2015, 7(5):89-101 Nickel It is found in all soils and is emitted from volcanoes. Pure nickel is a hard, silvery-white metal that is combined with other metals to form alloys. Some of the metals that nickel can be alloyed with are iron, copper, chromium, and zinc. These alloys are used in the making of metal coins and jewelry and in industry for making metal items. Nickel and its compounds have no characteristic odor or taste. Nickel is required to maintain health in animals. A small amount of nickel is probably essential for humans, although a lack of nickel has not been found to affect the health of humans Nickel compounds are also used for nickel plating, to color ceramics, to make some batteries, and as catalysts that increase the rate of chemical reactions. Major sources of exposure are: tobacco smoke, auto exhaust, fertilizers, superphosphate, food processing, hydrogenated-fats-oils, industrial waste, stainless steel cookware, testing of nuclear devices, tobacco smoke, baking powder, combustion of fuel oil, dental work and bridges. Acute toxic effects occur in two stages, immediate and delayed. Headache, dizziness, shortness of breath, vomiting, and nausea are the initial symptoms of overexposure; the delayed effects (10 to 36 h) consist of chest pain, coughing, shortness of breath, bluish discoloration of the skin, and in severe cases, delirium, convulsions, and death. Sorption kinetics describes the solute uptake rate and evidently this rate controls the residence time of adsorbate at the solid-liquid interface. Studies on the kinetics of metal sorption by various adsorbents are of importance for designing an adsorption system. The rate at which sorption takes place is of utmost importance when designing batch sorption systems. Consequently, it is important to establish the time dependence of such systems for various processes (Imaga C. et al., 2014). The results from such studies provide information on the minimum time required for considerable adsorption to take place and information on diffusion control mechanism between metal ions as they move towards the adsorbent surface. In this study, Sorghum Hull(sorghum bicolor) was used as biosorbent in the removal of heavy metal Ni2+from aqueous solution in a batch sorption system. The effects of contact time, mechanisms and sorption kinetics of the carbonised and Mercapto-acetic acid modification and Particle size will be investigated. EXPERIMENTAL SECTION 2.1 Materials The Sorghum Hulls (Sorghum bicolor) were sourced from a brewery (Consolidated Breweries plc, Imo State, Nigeria). The material Sorghum hull was later abbreviated as ‘SH’. All reagents used were analytical grades purchased and used without further purification. 3.0Methods 3.1Adsorbent Preparation The Sorghum Hulls were washed and air dried in preparation for the adsorption analysis. The air dried Sorghum Hulls were crushed with a manual blender to smaller particles and sieve analysis was performed using the mechanical sieve screen to obtain final sample sizes of 150µm and 250µm. 3.2Activation of Sorghum Hulls The screened fine Sorghum Hulls powder was further soaked in excess of 3.0M HNO3 solution for 24 hours. It was then filtered through a Whatman No.41 Filter paper and rinsed with deionised water. The rinsed Sorghum Hulls were later air dried for 24 hours. The treatment of the biomass with 3.0M HNO3 solution aids the removal of any debris or soluble biomolecules that might interact with metal ions during sorption. This process is called chemical activation of the Sorghum Hulls. 3.2.1Carbonisation of Sorghum Hulls The process was carried out using a Muffle furnace(Carbolite Sheffield, England, LMF4) which allowed limited supply of air. The carbonization took place at 250oC for one hour after which the charred products were allowed to cool to room temperature. 3.2.2Preparation of Adsorbate Solutions for Sorption Studies A stock solution of 1000ppm of the metal Nickel was prepared from Nickel Acetate (C4H6NiO4 or Ni(C2H3O2)2; assay 99% (BDH laboratory reagent). Thereafter, serial dilution was carried out on the stock solution to obtain 90
Imaga C. C. et al ______________________________________________________________________________ J. Chem. Pharm. Res., 2015, 7(5):89-101 working solution of 60 ppm of the metal ion. The concentration of the standard was confirmed using an Atomic Adsorption Spectrophotometer .The pH of the solution was kept at 7.0. 3.2.3Sorption Studies at Different Contact Time Kinetics of sorption studies were carried out according to the method described by Imaga C. etal., 2014. Kinetics of sorption for Ni2+was carried out for each adsorbent (CUSH 150µm and 250µm) at pH of 7.0 and temperature of 28oC (301K).30cm3 of standard solution of the metal, initial concentration of 60mg/l was transferred into various 250cm3 Erlenmeyer flask and labelled. Then 0.2g of each adsorbent CUSH 150µm and 250µm was transferred into the different flasks and agitated in a shaker for different contact times (20, 40, 60, 80 and100 minutes). After each agitation time, the content of the flask was then filtered using Whatman No.41 filter paper. The residual concentration of metal ions in 20cm3 of the filtrate of each metal solution was determined using Atomic Adsorption Spectrophotometer (AAS) (GBC SCIENTIFIC AVANTA PM AAS A.C.N 005472686 manufactured by GBC Scientific equipment Pty Ltd. Dandenong Victoria Australia.). The adsorbed concentration was then calculated by difference. Glass wares and plastic wares were washed with deionized water and rinsed to eliminate errors (Imaga C. et al., 2014). RESULTS AND DISCUSSION 4.1 Effect of Contact Time on Amount of Metal Ion Adsorbed The amount of metal adsorbed by an adsorbent at a particular time is one of the factors governing the efficiency of adsorption. The amount of Ni2+ adsorbed by the adsorbents CUSH 150µm and 250µm as a function of time is presented in table 1. The variation in the amount of the metal ion adsorbed by the adsorbents is shown in figure1. TABLE 1: Effect of contact time on amount of metal ion concentration adsorbed for CUSH 150µm and 250µm Amount of Metal ion concentration adsorbed Ni2+ 150µm 20 37.859 40 38.254 60 37.604 80 38.208 100 37.854 CONTACT TIME(MINS) Ni2+ 250µm 38.293 37.726 38.545 38.438 37.982 38.8 38.6 AMOUNT ADSORBED (mg/l) 38.4 38.2 Ni2+ CUSH 150µm 38 Ni2+ CUSH 250µm 37.8 37.6 37.4 0 20 40 60 80 100 120 CONTACT TIME (MINUTES) Fig 1: Graph of Amount Adsorbed versus Contact Time for Ni2+ (CUSH 150µm and 250µm) The maximum adsorption time for 150µm and 250µm were at 40th and 60th minutes(38.254mg/l and 38.545mg/l), respectively. The rate of adsorption in 250µm occurred faster (20th, 60th, 80thand 100thminutes) [38.293, 38.545, 91
Imaga C. C. et al ______________________________________________________________________________ J. Chem. Pharm. Res., 2015, 7(5):89-101 38.438 and 37.982]mg/l than in 150µmexcept in the 40th minute where the adsorption of Ni2+ was higher in 150µm than in 250µm.This could be attributed to the non-chemical modification of the two pore sizes of the adsorbent. 4.2 Kinetic Modelling Quantification of the changes in sorption of metals with time requires the use of appropriate kinetic model. The kinetic models Pseudo first and Second order and Elovich models were employed to investigate the kinetics of sorption of the divalent metal ion by the adsorbents. 4.2.1Pseudo-First Order Model The pseudo-first order adsorption kinetic rate equation is expressed as: ln???− ??? = ln??− ??? Where, qe is the equilibrium biosorption capacity in mg/g qt is the sorption capacity at any time, t in mg/g K1 is the pseudo-first order rate constant in gmg-1.min-1 The plot of the pseudo- first order is not shown as the data could not be generated because pseudo-first order did not give any measure of fit to the kinetic data. 4.2.2 Pseudo-Second Order Model The pseudo-second order adsorption kinetic rate equation is expressed as: ??? ??= ?????− ???? Where K2 (g/mg/min) is the rate constant of pseudo-second order adsorption. qe and qt (mg/g) respectively, are the sorption capacity at equilibrium and at time t. For the boundary conditions t=0 to t=t and qt=qt, the integrated form of the above equation becomes: ? ?????= This is the integrated rate law for a pseudo-second order reaction. The rate equation can be rearranged to obtain; ??= ? ??????? ?? This has a linear form; ? ??= Where hocan be regarded as the initial rate as (t/qt)→ 0 hence ho(mg/g/min) ℎ= ???? The equation becomes ? ??= A plot of t/qt versus t gives a linear relationship from which qe and K2 can be determined from the slope and intercept of the plot, respectively (C. Theivarasu et.al., 2010). The pseudo-second order rate equation was tested for the sorption of Ni2+ ion on CUSH 150µm and 250µm, respectively. Table 2, presents data for the pseudo-second order constants. The variation oft/qt with time from the pseudo-order equation fits the adsorption of the metal ion by the adsorbents is shown in figures 2 and 3. [1] [2] ? ??+ ?? [3] ? [4] ⁄ ? ⁄ ?????+ 1 ?? ? [5] ? [6] ? !"+ 1 ????? ⁄ [7] 92
Imaga C. C. et al ______________________________________________________________________________ J. Chem. Pharm. Res., 2015, 7(5):89-101 Table 2: Pseudo Second Order constants for CUSH 150µm and 250µm Nickel (II) ion CONSTANTS CUSH 150µm 0.9998 2.972 96.154 5.688 CUSH 250µm 0.9997 2.244 73.529 5.724 R2 K2(gmg-1min-1) ho(mgg-1min-1) qe(mgg-1) The results obtained show a highly significant linear relationship of the sorbed ion by the various adsorbents. The correlation coefficient (R2) values are high(0.9998and 0.9997) showing that pseudo second order model gave the best fit and describes the adsorption of the Nickel(II) ion of the two adsorbents. 20 Ni2+ CUSH 150µm 18 16 14 12 t/qt 10 8 Ni2+ CUSH 150µm 6 4 2 0 0 20 40 60 80 100 120 Contact Time (Minutes) Fig 2 Pseudo Second Order Isotherm Model of Ni2+ CUSH 150µm 20 Ni2+ CUSH 250µm 15 t/qt 10 Ni2+ CUSH 250µm 5 0 0 20 40 60 80 100 120 Contact Time (Minutes) Fig 3 Pseudo Second Order Isotherm Model of Ni2+ CUSH 250µm 4.2.3 Elovich Isotherm Model Elovich model equation was also used successfully to describe thesecond order kinetic assuming that the actual solid surfaces are energetically heterogeneous, but the equation does not propose any definite mechanism for adsorbate– 93
Imaga C. C. et al ______________________________________________________________________________ J. Chem. Pharm. Res., 2015, 7(5):89-101 adsorbent. It has extensively been accepted that the chemisorption process can be described by this semi-empirical equation given below. The linear form of this equation is given by (S. M. Yakout and E. Elsherif, 2010): ??= Whereα is the initial adsorption rate (mg/g min), and the parameter β is related to the extent of surface coverage and activation energy for chemisorption (g/mg).The Elovich coefficients could be computed from the plots qt versus ln t. The initial adsorption rate, α, and desorption constant, β, were calculated from the intercept and slope of the straight- line plots of qt against lnt. Table 3 lists the kinetic constants obtained from the Elovich equation. It will be seen that applicability of the simple Elovich equation for the present kinetic data indicates that the Elovich equation was unable to describe properly the kinetics of the metal ion on the adsorbents of the two pore sizes. The value of αand β varied as a function of the solution temperature. Also, the experimental data did not give a good correlation for these results. Table 3: Calculated values of Elovich isotherm model constants of adsorbents 150µm and 250µm CONSTANTS Ni2+ 150µm R2 5E-05 Β(gmg-1) 2500 α(mgg-1min-1) 1.936e+6176 5.76 Ni2+ CUSH 150µm ? #$%?&'? + ? #$%? [8] Ni2+ 250µm 0.0026 243.902 6.419e+602 Ni2+ CUSH… 5.74 5.72 qt (mg/g) 5.7 5.68 5.66 5.64 5.62 0 0.5 1 1.5 2 2.5 3 3.5 4 4.5 5 lnt Fig 4 Elovich Isotherm Model of Ni2+ CUSH 150µm 5.8 Ni2+ CUSH… Ni2+ CUSH 250µm 5.75 qt (mg/g) 5.7 5.65 0 0.5 1 1.5 2 2.5 3 3.5 4 4.5 5 lnt Fig 5 Elovich Isotherm Model of Ni2+ CUSH 250µm 4.3 Adsorption Mechanisms 4.3.1 Liquid Film Diffusivity Model The kinetics of adsorption of metal ions on various adsorbents may be controlled by several independent processes such as bulk diffusion, external mass transfer, film diffusion, chemical reaction, and intra particle diffusion. Itodo et al., (2010) used the linear driving force concept and developed a simple relationship: 94
Imaga C. C. et al ______________________________________________________________________________ J. Chem. Pharm. Res., 2015, 7(5):89-101 ln (1- αe) = -Kpt +DF Here αe= qt/qeis the fractional attainment of equilibrium and Kp is the rate constant. A plot of ln (1-αe) versus time (t) yields the KP the rate constant (min-1) as the slope of the graph and a dimensionless constant DF as intercept. If a plot of ln (1- αe) against t is a straight line, then adsorption is controlled by particle diffusion and the diffusion of the metal ions to the adsorbent surface is independent of the initial concentration of the metal ions, if it is not a straight line, then it indicates that the sorption process is controlled by film- diffusion. The fractional attainment at equilibrium is the ratio of the amounts of sorbate removed from solution after a certain time to that removed when sorption equilibrium is attained. It would definitely be expected that factors such as the number of reactive sites on the substrate and the bulkiness of the substrate would affect the rate of sorption. However, a great deal of information is gotten from the fractional attainment of equilibrium. The rate of attainment of equilibrium may be either film diffusion controlled or particle-diffusion controlled, even though this two different mechanism cannot be sharply demarcated (Itodo et. al., 2010). Table 4: Liquid Film Diffusivity constants for CUSH 150µm and 250µm CONSTANTS Ni2+ 150µm R2 0.6000 Kp(min-1) 3x10⁻⁵ DF -0.0258 0.03 [9] Ni2+ 250µm 0.1073 60x10-5 -0.0625 Ni2+ CUSH 250µm 0.02 y = 0.0003x - 0.0227 R² = 0.1073 0.01 ln(1-αe) 0 0 20 40 60 80 100 120 -0.01 -0.02 -0.03 Contact Time (Minutes) -0.04 Fig 6 Liquid Film Diffusivity Model for CUSH 250µm -0.0225 0 20 40 60 80 100 120 -0.023 -0.0235 y = 3E-05x - 0.0258 R² = 0.6 Ni2+ CUSH 150µm -0.024 ln(1-αe) -0.0245 -0.025 -0.0255 -0.026 -0.0265 Contact Time (Minutes) Fig 7 Liquid Film Diffusivity Model for CUSH 150µm The R2 value of Ni2+ 150µm and 250µm suggests that the diffusivity model does not entirely support the adsorption of Ni2+ using the adsorbent and its two pore sizes. The diffusion rate constant Kp and the linear driving force DF (diffusion parameter) obtained from the slope and intercepts of the plots are presented in table 4.A look at figures 6 95
Imaga C. C. et al ______________________________________________________________________________ J. Chem. Pharm. Res., 2015, 7(5):89-101 and 7 shows that Ni2+150µm and 250µm is not a straight line describing Ni2+ 150µm and 250µmas film diffusion controlled since the plotted graph is non- linear. Consequently, in an adsorption process, the metal ions from the bulk solution should move through the thin liquid film surrounding the adsorbent. The thin film may produce a diffusion barrier for the metal ion to penetrate before they arrive at the binding sites on the adsorbent. This suggests that the metal ion must overcome this film barrier to be adsorbed at the sites on the adsorbent. This mechanism is consistent with the fact that the rate of diffusion of the metal ion also affects adsorption rate. This conclusion was also arrived at by Abia and Asuquo (2005) in their study onPb2+, Ni2+, Cd2+ and Cr3+with oil palm fibre. 4.3.2 Mass Transfer Model The mass transfer kinetic model is generally expressed as (Abia et al., 2006) )− )?= *+,-??.?? Where, CO is the initial metal ion concentration (mg/l) Ct is the metal ion concentration at time t in mg/l T is the shaking time in minutes D is the fitting diameter KO is a constant which is the mass transfer adsorption coefficient A linearized form of the equation is written thus: ln?)− )?? = ln* + ??[11] If the sorption of the metal ion is depicted by the mass transfer model, then the plot of ln (Co-Ct) versus time should give a linear relationship from where lnD and Ko can be determined from the intercept and slope of the plot, respectively. Table 5: Mass Transfer Constants for CUSH 150µm and 250µm CONSTANTS Ni2+ 150 µm R2 0.0041 D 22.010 KO 3E-05 CUSH 150µm [10] Ni2+ 250 µm 0.0017 21.828 -2E-05 3.12 3.11 3.1 ln (Co-Ct) 3.09 Ni2+ CUSH 150µm 3.08 3.07 0 20 40 60 80 100 120 Time (minutes) Fig 8 Mass Transfer Model of Ni2+ CUSH 150µm 96
Imaga C. C. et al ______________________________________________________________________________ J. Chem. Pharm. Res., 2015, 7(5):89-101 CUSH 250µm 3.11 3.1 ln (Co-Ct) 3.09 3.08 Ni2+ CUSH 250µm 3.07 3.06 0 20 40 60 80 100 120 Time (minutes) Fig 9Mass Transfer Model of Ni2+ CUSH 250µm From the results, the low R2 values suggest that the mass transfer diffusivity model does not support the adsorption of the metal ions using the adsorbent with its two pore sizes. Mass transfer is the movement of chemical species in a fluid mixture caused by some forms of driving force. There are two main mechanisms of mass transfer: diffusion and mass transport by convection (Aikpokpodion Paul E. et al., 2013). These mechanisms (diffusion and mass transport by convection) were not supported suggesting that mass transfer model does not favour the sorption of Ni2+. The diffusion rate constant Ko and D(fitting parameter) obtained from the slope and intercepts of the plots are presented in table 5. A look at figures 8 and 9 shows that the plots are not very linear; suggesting that the sorption process is not diffusion and mass transport by convection controlled. The low R2 values confirm this. Hence, diffusivity model parameters were then used as film-diffusion controlled. Aikpokpodion Paul E. et al., 2013 stated that the rate of diffusion of ions between soil solution and soil surfaces is generally low due to molecular collisions that give rise to extremely strong hindrance to the movement of molecules. 4.3.3 Intra Particle Diffusivity Model Intra particle diffusivity equation for description of sorption kinetics was explored using the intra-particle diffusivity model given below (Hassan Zavvar et al., 2012): ??= ?/???/?+ ) Where, kid is the rate of sorption controlled by intra particle diffusivity (mgg-1min-1(1/2)) C depicts the boundary layer thickness. This model predicts that the plot of qt versus t1/2 should be linear with kid and C as slope and intercept respectively if intra particle diffusivity is involved in the sorption process. Intra particle diffusivity is the rate controlling step if the line passes through the origin. Table 6: Intra Particle Film Diffusivity Constants for CUSH 150µm and 250µm CONSTANTS Ni2+ 150 µm R2 0.0002 Kid(mgg-1min-1(1/2)) -1.8 x 10⁻³ C 37.969 [12] Ni2+ 250 µm 0.0029 8.4 x 10⁻³ 38.134 97
Imaga C. C. et al ______________________________________________________________________________ J. Chem. Pharm. Res., 2015, 7(5):89-101 38.4 CUSH 150µm 38.2 qt (mg/g) 38 37.8 Ni2+ CUSH… 37.6 37.4 0 2 4 6 8 10 12 t1/2(min)1/2 Fig10 Intra Particle Diffusivity Model for Ni2+ CUSH 150µm 38.6 CUSH 250µm 38.4 qt (mg/g) 38.2 38 Ni2+ CUSH 250µm 37.8 37.6 0 2 4 6 8 10 12 t1/2(min)1/2 Fig 11Intra Particle Diffusivity Model for Ni2+ CUSH250µm According to Itodo A.U et al., 2010, of the intraparticle diffusivity plot, the sorption mechanism assumes an intraparticle diffusivity model if the following conditions are met: 1.High R2 values to ascertain applicability 2.Straight line which passes through the origin for the plot area qt versus t1/2 3.Intercept C< 0. A validity test which deviates from 2 and 3 above shows that the mode of transport is affected by more than one process (Hameed, 2009).The intercept C values are very high (well above zero values). Higher values of kid illustrate an enhancement rate of adsorption, whereas, larger kid values illustrate better adsorption which is related to improved bonding between adsorbate and adsorbent particles(Itodo A.U et al., 2010). From the assertion above, the values of kid are relatively very low showing that there is no enhancement rate of adsorption which illustrates no adsorption and no better bonding between adsorbate and adsorbent particles. From the results obtained in table 6, it shows that none of these conditions (1, 2 and 3) listed above were met suggesting that the intraparticle diffusivity model adsorption mechanism does not in any way favour the adsorption of Ni2+ with the adsorbent of the two different pore sizes. 4.3.4 Intra Particle Diffusion Model The intraparticle diffusion model, according to (Akpokpodion Paul E. et al., 2013) (A.A. Abia et al., 2007) is expressed as: 1 = ?/????2 [13] 98
Imaga C. C. et al ______________________________________________________________________________ J. Chem. Pharm. Res., 2015, 7(5):89-101 Linearising the equation, becomes log1 = log?/?+ 2log? Where, R is the percent of metal ion adsorbed t is the contact time in minutes a is the slope on a logarithmic plot which depicts the adsorption mechanism Kid is the intra particle diffusion rate constant which is taken as a rate factor, that is , percent of the sorbate adsorbed per unit time (mgg-1min-1(1/2)) If the sorption can be represented by the model, a plot of log R versus log t should yield a linear relationship with a slope a and an intercept log Kid. According to (Akpokpodion Paul E. et al., 2013),this model is based on the assumption that, diffusion into the interior pores of the soil particles from the soil solution controls the adsorption of Mg2+ onto the studied soils. 1.806 CUSH 150µm [14] Ni2+ CUSH 150µm 1.804 1.802 LogR 1.8 1.798 1.796 0 0.5 1 1.5 2 2.5 LogT Fig 12 Intra Particle Diffusion Model for Ni2+ CUSH 150µm CUSH 250µm 1.81 1.808 1.806 Log R 1.804 1.802 Ni2+ CUSH 250µm 1.8 1.798 0 0.5 1 1.5 2 2.5 Log T Fig 13Intra Particle Diffusion Model for Ni2+ CUSH250µm From the results obtained in table 7, it follows that R2, kid and a values are low suggesting that the intraparticle diffusion model adsorption mechanism does not in any way favour the adsorption of Nickel(II) ion with the adsorbent of the two pore sizes. This means that the values of kid being relatively very low shows that there is no enhancement rate of adsorption which illustrates no adsorption and no better bonding between sorbate and sorbent particles. Higher values of kid illustrate an enhancement rate of adsorption, whereas, larger kid values illustrate better adsorption which is related to improved bonding between sorbate and sorbent particles (Itodo A.U et al., 2010). 99
Imaga C. C. et al ______________________________________________________________________________ J. Chem. Pharm. Res., 2015, 7(5):89-101 Table 7: Intra Particle Film Diffusion Constants for CUSH 150µm and 250µm CONSTANTS Ni2+ 150 µm R2 1E-05 a -4 x 10 -5 Kid(mgg-1min-1(1/2)) 0.2556 Ni2+ 250 µm 0.0092 1.64 x 10⁻² 0.2441 4.4 Pore Size Analysis One of the most important adsorbent parameters is the pore size and pore size distribution. Adsorbent surface area is the factor directly affecting the analyte retention. Pore size is defined as the ability of the analyte molecules to penetrate inside the particle and interact with its inner surface. This is especially important because the ratio of the outer particle surface to its inner one is about 1:1000. The surface molecular interaction mainly occurs on the inner particle surface. Micro-pores are easily accessible to the analytes since there is littleor no steric hindrance effect. Meso-pores are partially accessible, but molecular diffusion into the pore spaces are restricted by steric hindrance effect which significantly slows mass transfer and decreases the adsorption efficiency (IMAGA C.C and ABIA A.A). From the results, the two pore sizes are effective to use and can equally serve as a good low cost adsorbent for the sorption of Ni2+ from aqueous solution. CONCLUSION The conclusions based on experimental study were: (i)Adsorbent preparation by carbonization and non-chemical modification of biosorbent showed good affinity for the metal ionNi2+. (ii)The result obtained can be used for design purposes. (iii)These results can be used as a basis for the study of desorption and recovery of Nickel(II)ion from solution. (iv)Pore size analysis showed that 250µm mesh had faster adsorption rate than 150µm mesh except at the 40th minute, although both recorded high adsorption values. (v)For liquid film diffusivity model, Ni2+ 150µm and 250µmboth favours film diffusion controlled adsorption. (vi)Intraparticle diffusivity model, Intraparticle diffusion model, Mass transfer model, Pseudo first order model and Elovich model did not in any way favour the adsorption of Ni2+ from solution. REFERENCES [1]Abia .A.A. and Igwe, J.C. (2005). African Journal of Biotechnology 4(6):509-512 [2]Abia, A.A, Asuquo, E.D (2007) Tsinghua Science and technology 12 (4) pp485-492 [3]Aikpokpodion Paul E, Osobamiro T, Atewolara-Odule O. C, Oduwole O. O. and Ademola S. M (2013) Journal of Chemical and Pharmaceutical Research, 2013, 5(6):128-139 [4]B.H Hameed, D.K Mahmoud, A.L Ahmad (2008) Journal of Hazardous Materials 158(2008)65-72 [5]Babarinde N.A.A;Babalola J.O;Adebisi, O.B (2008) International Journal of Physical Sciences Vol3(2) Pp 050- 055. [6]DemirbasOzkan, AlkanMahir (2011) In Tech ISBN 978-953-307-627-0 .DOI: 10.5772/22833. [7]Hassan ZavvarMousavi, A bdorrahmanHosseinifar and VahdatJahed (2012) J. Serb. Chem. Soc. 77 (3) 393–405 (2012) 393 -405 [8]Horsfall, M. Jnr. Abia, A.A. and Spiff, A.I. (2004). Bull Korean chem. Soc. 25(7): 969-976. [9]Igwe J C and Abia A A (2006): Afric.J Biotech 5 (12) 1167-1179. [10]Igwe JC, Nwokennaya EC, Abia AA. 2005. Afr. J. Biotechnology, 4(10): 1109-1112. [11]Imaga, C, Abia, A..A, Igwe, J.C. (2014) “Removal of Ni (ll), Cu (ll), and Zn (ll) ions from synthetic waste water using sorghum hull as adsorbents.” Pelagia research library. Der ChemicaSinica [12]Imaga, C.C., Abia, A.A (2014) Journal of Pure and Applied Chemistry.Vol.2014(2014) [13]Itodo A.U., Abdulrahman F.W, Hassan L.G, Maigandi S.A., Itodo H.U (2010) “Intraparticle Diffusion and Intraparticulate Diffusivities of Herbicide on Derived Activated Carbon”. http://www.sciencepub.net/researcher. (2010) 74 - 86 [14]M.Urik; P. Littera; J.Sevc; M.Kolencik; S.Cernansky (2009) .Int.J.Environ.Sci.Tech.,6(3), 451-456 [15]Opeolu,B.O;Bamgbose,O;Arowolo,T.A; Adetunji,M.T;(2009) African Journal of Biotechnology.Vol 8 (8) pp1567-1573. [16]Qadeer, R and Akhtar, S. (2005) Turk.J.Chem.29:95-99 100
Imaga C. C. et al ______________________________________________________________________________ J. Chem. Pharm. Res., 2015, 7(5):89-101 [17]S. M. Yakout and E. Elsherif (2010) Applied Science Innovations Pvt. Ltd., India Carbon – Sci. Tech. 1 (2010) 148 – 149 [18]Suleman Qaiser, Anwar R. Saleemi, Muhammad Umar (2009) Electronic Journal Of Biotechnology Vol.12 No4 [19]Theivarasu C., Mylsamy S. (2010) International journal of engineering science and Technology vol. 2 (ll), 2010, 6284-6292 [20]Zolgharnein, J.; Asanjarani, N.and Shariatmanesh, T. (2011) Toxicological and Environmental Chemistry, 93:2,207-214. 101