Download
1 / 26
260 likes | 355 Vues
Construction of genetic map of Laccaria bicolor Strain S 238N. Third Workshop of the Laccaria Genome Consortium INRA-Nancy,April 4 2006. Jessy Labbé, François Le Tacon and Francis Martin. Why a genetic linkage map of Laccaria bicolor?. Interests of genetic linkage map.

E N D
Construction of genetic map of Laccaria bicolor Strain S 238N Third Workshop of the Laccaria Genome Consortium INRA-Nancy,April 4 2006 Jessy Labbé, François Le Tacon and Francis Martin
Interests of genetic linkage map • localization of the genes by positional cloning • Studies of genomes comparing cartography • Help in assembly of complete genome during a massive random sequencing Having a linkage map is like having a roadmap
Interests of genetic linkage map Reads Genetic Map R1 R1 R2 gap contig R2 assembly scaffold R1 R2 Assembled genome • Indeed difficulties can appear during the assembly in front of repeated sequences
What is a genetic linkage map ?
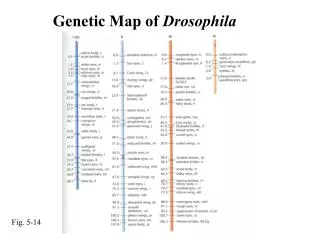
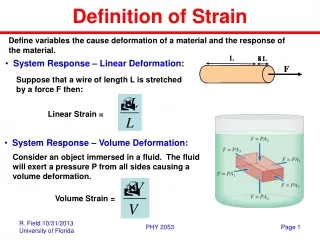
Definition of genetic linkage map • A genetic linkage map is a graphic representation of the arrangement of markers on the chromosomes A.Thaliana genetic map
principe of genetic mapping A1 B2 C2 A1 B1 C2 A1 B1 C1 B1 C1 B2 C1 B2 C2 A2 A2 A2 Type 1 : Type 3 : Type 5 : A1 B2 C2 A1 B1 C2 A1 B1 C1 Type 2 : Type 4 : Type 6 : A2 B1 C1 A2 B2 C1 B2 C2 A2 • Recombination frequency is an indirect measure of distance along a DNA molecule. Recombination frequencies can be measured with respect to many different types of genetic processes, the most frequent being meiotic recombination. Generally, the frequency of recombination between two loci is proportional to the physical distance between these 2 loci. Meïotic Crossing Over: Recombination parental or recombinant gametes
Construction of a genetic map 1. Mark out chromosomes with markers 2. Determine the relative position of the markers (genetic distance)
The used segregating population • A large progeny is generally needed to build a genetic linkage map. There are several ways to address the progeny limitation. A method applicable to fungi is to directly genotype homokaryons which are produced after meïotic division. Population of 91 homocaryons
The used markers • Different markers to detect polymorphic loci : • SCAR markers (dominant) • RAPDs markers (dominant) GTT9 • Microsatellites markers (co-dominant) • SNPs markers (co-dominant)
SCAR markers 2 3 4 5 6 7 8 9 10 11 12 13 14 15 16 17 18 19 20 Scar 157/400 Scar 157/430 Polymorphism 1 21 22 23 25 26 27 28 30 31 32 33 35 36 37 38 39 24 29 34 430pb 400pb 1 marker Scar 174/240 Scar 157/430 240pb • Developed from RAPD markers by J.Weber and al., 2002
RAPDs markers • We used 25 RAPD primers generated by Doudrick and al, 1995 who produced this first genetic map of Laccaria bicolor (other strain)
RAPDs markers Homocaryons Dicaryon Ladder Polymorphism From 25 RAPD primers we generated 38 reproducible polymorphic markers
Microsatellites (SSR) markers GTT9 repeat Computer progam Magellan JAZZ assembly Amplification test Homocaryon Dicaryon Ladder Analyse of fragments with marked primer
Distribution of Microsatellites No SSRs/Mb Repeat type Relative abundance of SSRs across fungal genomes (No SSRs/Mb)
Distribution of Microsatellites Total number SSR / Mb Fungal genomes Relationship of relative abundance of the total SSRs in each genome
Single Nucleotide Polymorphic markers • Comparison of sequences allow to detect SNPs Amplification and Analyse of fragments with marked primer Not still realized
First results SCAR RAPDs Microsatellites SNPs 6 <R16> 0 5 4 <R4> 0 1 <R26> 0 2 3 <R6> 0 <R14> 26 <R7> 0 <R21> 0 <R32> 43 <R20> 24 <R19> 36 <R35> 33 <R11> <R13> <R31> 46 51 64 39 markers Mapping program JOINMAP V3.0 First test :
Comparison 6 <R16> 0 5 4 <R4> 0 1 <R26> 0 3 <R6> 0 <R14> 26 <R7> 0 <R32> 43 <R19> 36 <R35> 33 <R11> <R13> <R31> 46 51 64 2 <R21> 0 <R20> 24 It is necessary to saturate this map
Physical correspondence…… Prelevement on gel of markers Cloning Sequencing Blast
Physical correspondence…… 5 <R4> 0 6 <R16> 0 4 1 <R26> 0 2 3 <R6> 0 <R14> 26 <R7> 0 <R21> 0 <R32> 43 <R11> 51 <R20> 24 <R19> 36 <R35> 33 <R13> <R31> 46 64 SC 37… SC 70…others SC 8 SC 44 SC 14 SC 38 …… SC 41 SC 4 SC 54…. SC 31 …. SC 57 ……. SC 24… SC 47 …… SC 1 SC 33…
Prospect….. • The objective is to saturate this map with microsatellites and SNPs markers Next days microsatellites will be analyzed and will generate new markers We shall develop at the same time the first SNPs So more datas will allow to improve scaffold assembly
Thanks to…… François Le Tacon Francis Martin Sylvain Jeandroz Virginie Achéré Marc Buée Stéphane Uroz Sébastien Duplessi Annegret Kholer Christine Delaruelle Aurélie Deveau Pierre-Emmanuel Courty And to you for listening………