Download
1 / 5
50 likes | 92 Vues
A simple and sensitive spectroscopic method was developed for the estimation of CEFAD in pharmaceutical dosage forms. This method is based on CEFAD, showing absorbance at 257 nm in methanol. This method obeys Beers law in the concentration range of 10 to100 µg mL-1 respectively. The proposed method is precise, accurate and reproducible and can be extended to the analysis of CEFAD in bulk and tablet formulations.

E N D
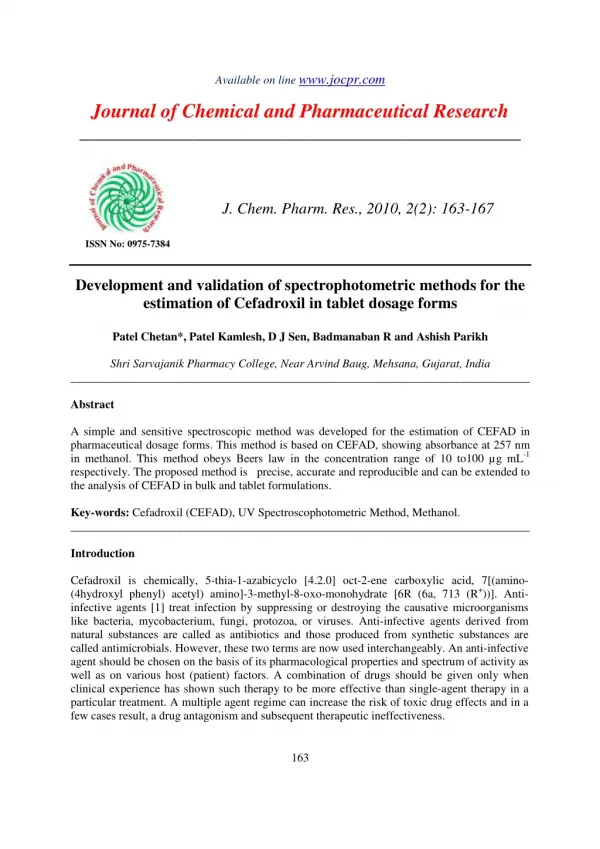
Available on line www.jocpr.com Journal of Chemical and Pharmaceutical Research __________________________________________________ J. Chem. Pharm. Res., 2010, 2(2): 163-167 ISSN No: 0975-7384 Development and validation of spectrophotometric methods for the estimation of Cefadroxil in tablet dosage forms Patel Chetan*, Patel Kamlesh, D J Sen, Badmanaban R and Ashish Parikh Shri Sarvajanik Pharmacy College, Near Arvind Baug, Mehsana, Gujarat, India ______________________________________________________________________________ Abstract A simple and sensitive spectroscopic method was developed for the estimation of CEFAD in pharmaceutical dosage forms. This method is based on CEFAD, showing absorbance at 257 nm in methanol. This method obeys Beers law in the concentration range of 10 to100 µg mL-1 respectively. The proposed method is precise, accurate and reproducible and can be extended to the analysis of CEFAD in bulk and tablet formulations. Key-words: Cefadroxil(CEFAD), UV Spectroscophotometric Method, Methanol. ______________________________________________________________________________ Introduction Cefadroxil is chemically, 5-thia-1-azabicyclo [4.2.0] oct-2-ene carboxylic acid, 7[(amino- (4hydroxyl phenyl) acetyl) amino]-3-methyl-8-oxo-monohydrate [6R (6a, 713 (R+))]. Anti- infective agents [1] treat infection by suppressing or destroying the causative microorganisms like bacteria, mycobacterium, fungi, protozoa, or viruses. Anti-infective agents derived from natural substances are called as antibiotics and those produced from synthetic substances are called antimicrobials. However, these two terms are now used interchangeably. An anti-infective agent should be chosen on the basis of its pharmacological properties and spectrum of activity as well as on various host (patient) factors. A combination of drugs should be given only when clinical experience has shown such therapy to be more effective than single-agent therapy in a particular treatment. A multiple agent regime can increase the risk of toxic drug effects and in a few cases result, a drug antagonism and subsequent therapeutic ineffectiveness. 163
Patel Chetan et al J. Chem. Pharm. Res., 2010, 2(2): 163-167 _____________________________________________________________________________ Materials and methods Experimental section Apparatus and software Shimadzu UV 1601 double beam spectrophotometer connected to a computer loaded with Shimadzu UVPC software was used for all the spectrophotometric measurements. The spectral bandwidth was 1 nm and the wavelength scanning speed was 2800 nm min-1. The absorption spectra of the reference and test solutions were carried out in a 1 cm quartz cells over the range of 200 - 350 nm. Reagents and Pharmaceutical Preparations CEFAD was kindly supplied by Dr.Reddy laboratories (Hyderabad, A.P, India) the drug was used without further purification. All the solvents used in Spectrophotometric analyses were of spectroscopic grade. Commercial pharmaceutical preparations of CEFADROX from Dr. Reddy laboratories (Hyderabad, A.P, India) which were claimed to contain 100mg of CEFAD as used in analysis. Preparation of standard CEFAD solution It was used stock solutions of 1mg mL-1 CEFAD in mixture of methanol. The working solution of 0.1 mg mL-1 prepared by transferring 5mL from respective stock solution to a 50 ml volumetric flask and completing to volume with the mixture of methanol. Sample preparation A total ofpowder from 10 tablets was accurately weighed and an amount equivalent to 100mg was taken and dissolved in 60 ml of methanol and sonicate for five minutes. About 10 ml of methanol was added and sonicate for another 5 minutes. The mixture was shaked well for 2 minutes and transferred to a 100ml volumetric flask through a Whatman No. 40 Filter paper. The residue was washed thrice with 10ml methanol and the combined filtrate was made up to the mark with methanol. The sample solution thus prepared was diluted with methanol to get the solutions containing different concentrations of CEFAD. Calibration sets A calibration set of 09 samples was prepared in methanol, UV spectra were recorded in the wavelength range 200-400 nm versus solvent blank and digitized absorbance was recorded at 1 nm intervals. The overlay zero orders spectra were recorded. Absorbance measured at 257 nm (λ max) was used to preparation of calibration curve. Result UV Spectrophotometric method was applied without using any prior chemical pretreatment [2]. Accurate results were obtained by utilizing the proposed method for the quantitation of CEFAD and a good agreement with the results obtained by the reported methods was found [3, 4, 5]. For UV spectrophotometric method, linearity was obtained in concentration range of 10-100 µg mL-1 for CEFAD respectively. The % recovery greater than 98 % shows that the method was free from the interference of excipients used in the formulation. The value of standard deviation and % R.S.D. were found to be less than 2 shows the high precision of the method. 164
Patel Chetan et al J. Chem. Pharm. Res., 2010, 2(2): 163-167 _____________________________________________________________________________ Figure 1: Absorption spectra of CEFAD (20 µg mL-1) Table 1 Optical characteristics and other Parameters of Method Parameter Results Absorption Maxima (nm) Beer’s Law limits(µg/ml) Molar extinction coefficient (mole-1 cm-1) Sandell’s sensitivity (µg/cm2/0.001absorbance units) Regression equation (y)* Slope (b) Intercept (a) Standard deviation ** 257 10-100 0.009274 0.0927919 0.9997 0.0093 0.0028 0.00332 Limit of detection µg ml-1 Limit of quantification µg ml-1 *y = a + bx; when x is the concentration and y is absorbance unit. 0.088749 0.268938 Table 2: Recovery study from standard solution %Recovery of CEFAD Concentration taken in (µg mL-1) % Standard addition *Average amplitude at 257 nm S.No 1 10 60 0.55± 0.0014 100.1 ± 0.9539 2 10 80 0.75± 0.0015 99.42 ± 0.9814 3 10 100 0.935± 0.0026 99.552 ± 0.9757 4 10 120 1.11 ± 0.0016 99.186 ± 0.9627 5 10 * Average amplitude at 257nm of three trials with SD 140 1.32 ± 0.0033 100.914 ± 0.9648 165
Patel Chetan et al J. Chem. Pharm. Res., 2010, 2(2): 163-167 _____________________________________________________________________________ Table 3: Recovery study from formulation Conc. Of standard (µg mL-1) %Recovery of CEFAD Conc. of sample (µg mL-1) *Average amplitude at 257 nm S.No 1 10 6 0.59 ± 0.001 99.93 ± 0.9841 2 10 8 0.79± 0.0017 99.42 ± 0.9937 3 10 10 0.939± 0.0029 100.51 ± 0.9867 4 10 12 1.15 ± 0.0021 100.084 ± 0.9957 5 10 14 1.36 ± 0.0039 101.196 ± 0.9867 *Average amplitude at 257nm of three trials with SD Table 4: Analysis of tablet formulation Tablet Label claimed (mg) Conc. found (mg) %Recovery ± SD CEFAD CEFAD CEFAD CEFADROX 100 99.98 99.69 ± 0.909 * Values in parentheses correspond to the parameters calculated after accounting for CEFAD, that is, values without standard addition. Conclusion The UV spectroscopic methods demonstrated herein, is applicable to the estimation of Cefadroxil in pure as well as in existing dosage forms. In order to ensure that the data generated of the above method is accurate and precise. The experiments have been performed on calibrated equipments using suitable reference standards. To prove and documents the reliability of the methods have been carried out to a possible extent. The results expressed in Table 1, 2 & 3 for spectrophotometric method. In addition to positive requirements for analytical methods, the striking advantage of all the presently developed methods is that they are economical. The proposed methods are found to be simple, sensitive, selective, accurate, precise and economical and can be used in the determination of cefadroxil in bulk drug and its pharmaceutical dosage forms (tablets) in a routine manner. Acknowledgements The authors thank the S.D. fine- chem., Mumbai. Cefadroxil was kindly gifted by Dr.Reddy Labs Pvt. Ltd, Hyderabad for research and Shri Sarvajanik Pharmacy College, Mehsana management, for providing all facilities to carry out the present work. 166
Patel Chetan et al J. Chem. Pharm. Res., 2010, 2(2): 163-167 _____________________________________________________________________________ References [1]Rang HD, Dale MM, Ritter JM, Moore PK. “Pharmacology” 5th edition, New Delhi: Elsevier India Pvt Ltd. 562. [2]Prasad MVV, Nagaraju R, Narayan TV. Indian J Pharm sci. 2004; 66(3):341-42. [3]Willard HH, Merritt LL, Dean JJA, Frank AS. Instrumental method of analysis. 7th Edition, CBS Publishers and Distributors, New Delhi, 2002; 321-23. [4]Basillo morelli, J Pharm and biochem analysis, 32(2); 257-67. [5]Gamal A. Saleh,Bedair .M.F. El Gindy,El waily, J of pharm Biomed analysis2000; 50-58. [6]Asian Guideline for Validation of Analytical Procedure Adopted from ICH Guideline, Q2A27 Oct. 1994 and ICH Q2B, 6th Nov. 1994. [7]Indian Pharmacopoeia – Vol-1; 1996; 144-46. [8]British Pharmacopoeia-Vol-3; 2003; 2544 & 2557. 167