Download
1 / 15
150 likes | 179 Vues
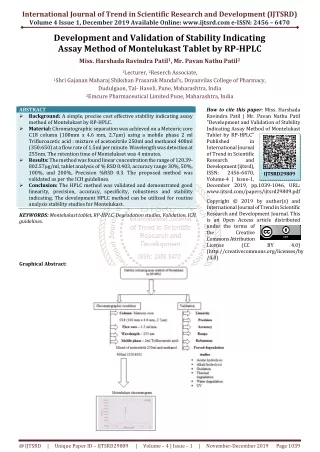
A rapid and precise reverse phase high performance liquid chromatographic method has been developed for the validated of Vortioxetine in its pure form as well as in tablet dosage form. Chromatography was carried out on ODS C18 4.6 x 250 mm, 5u00b5m column using Acetonitrile And Methonal 70 30 as the mobile phase at a flow rate of 1.0 mL min, the detection was carried out at 274nm. The retention time of the Vortioxetine was 2.922 u00b10.02min. The method produce linear responses in the concentration range of 20 u00b5g ml of Vortioxetine. The method precision for the determination of assay was below 2.0 RSD. The method is useful in the quality control of bulk and pharmaceutical formulations. Rathod K. G | Bargaje G. S | Rathod G. R | Deshpande O. V "Development and Validation of RP-HPLC Method for Estimation of Vortioxetine in Bulk and Pharmaceutical Dosage Form" Published in International Journal of Trend in Scientific Research and Development (ijtsrd), ISSN: 2456-6470, Volume-3 | Issue-6 , October 2019, URL: https://www.ijtsrd.com/papers/ijtsrd28040.pdf Paper URL: https://www.ijtsrd.com/pharmacy/analytical-chemistry/28040/development-and-validation-of-rp-hplc-method-for-estimation-of-vortioxetine-in-bulk-and-pharmaceutical-dosage-form/rathod-k-g<br>

E N D
International Journal of Trend in Scientific Research and Development (IJTSRD) Volume 3 Issue 6, October 2019 Available Online: www.ijtsrd.com e-ISSN: 2456 – 6470 Development and Validation of RP-HPLC Method for Estimation of Vortioxetine in Bulk and Pharmaceutical Dosage Form Rathod K. G#, Bargaje G. S, Rathod G. R, Deshpande O. V S. N. D. College of Pharmacy, Babhulgaon, Tal-Yeola, Nashik, Maharashtra, India ABSTRACT A rapid and precise reverse phase high performance liquid chromatographic method has been developed for the validated of Vortioxetine in its pure form as well as in tablet dosage form. Chromatography was carried out on ODS C18 (4.6 x 250 mm, 5µm) column using Acetonitrile And Methonal (70:30) as the mobile phase at a flow rate of 1.0 mL/min, the detection was carried out at 274nm. The retention time of the Vortioxetine was 2.922 ±0.02min. The method produce linear responses in the concentration range of 20 µg/ml of Vortioxetine. The method precision for the determination of assay was below 2.0 %RSD. The method is useful in the quality control of bulk and pharmaceutical formulations. KEYWORDS: Vortioxetine; RP-HPLC; PDA Detection; validation; Tablet dosage forms Corresponding Author: Rathod K. G S. N. D. College of Pharmacy, Babhulgaon, Nashik, Maharashtra, India 1.INTRODUCTION Pharmaceutical Analysis Plays a very vital role in the quality assurance and quality control of bulk drugs and their formulations. Pharmaceutical analysis is a specialized branch of analytical chemistry which involves separating, identifying and determining the relative amounts of components in a sample of matter. It is concerned with the chemical characterization of matter both quantitative and qualitative. 1.1.SPECTROPHOTOMETRIC METHODS Spectrophotometry is generally preferred especially by small-scale industries as the cost of the equipment is less and the maintenance problems are minimal. The method of analysis is based on measuring the absorption of a monochromatic light by colorless compounds in the near ultraviolet path of spectrum (200-380nm). The photometric methods of analysis are based on the Bouger-Lambert-Beer’s law, which establishes the absorbance of a solution is directly proportional to the concentration of the analyte. The fundamental principle of operation of spectrophotometer covering UV region consists in that light of definite interval of wavelength passes through a cell with solvent and falls on to the photoelectric cell that transforms the radiant energy into electrical energy measured by a galvanometer. How to cite this paper: Rathod K. G | Bargaje G. S | Rathod G. R | Deshpande O. V "Development and Validation of RP- HPLC Method for Vortioxetine in Bulk and Pharmaceutical Dosage Form" Published in International Journal of Trend in Scientific Research and Development (ijtsrd), ISSN: 2456- 6470, Volume-3 | Issue-6, October 2019, pp.74-88, URL: https://www.ijtsrd.com/papers/ijtsrd28 040.pdf Copyright © 2019 by author(s) and International Journal of Trend in Scientific Research and Development Journal. This is an Open Access article distributed under the terms of the Creative Commons Attribution License (CC (http://creativecommons.org/licenses/by /4.0) The important applications are Identification of many types of organic, inorganic molecules and ions. Quantitative determination of many biological, organic and inorganic species. Monitoring and identification of chromatographic of effluents. 1.2.HPLC METHOD DEVELOPMENT The term ‘Chromatography’ covers those processes aimed at the separation of the various species of a mixture on the basis of their distribution characteristics between a stationary and a mobile phase. 1.2.1.MODES OF CHROMATOGRAPHY Modes of chromatography are defined essentially according to the nature of the interactions between the solute and the stationary phase, which may arise from hydrogen bonding, Vander walls forces, electrostatic forces or hydrophobic forces or basing on the size of the particles (e.g. Size exclusion chromatography). Different modes of chromatography are as follows: Normal Phase Chromatography Reversed Phase Chromatography Reversed Phase – ion pair Chromatography Ion-Exchange Chromatography Size Exclusion Chromatography Estimation of IJTSRD28040 BY 4.0) @ IJTSRD | Unique Paper ID – IJTSRD28040 | Volume – 3 | Issue – 6 | September - October 2019 Page 74
International Journal of Trend in Scientific Research and Development (IJTSRD) @ www.ijtsrd.com eISSN: 2456-6470 1.3.METHOD VALIDATION Method validation can be defined as (ICH) “estabilishing documented evidence which provides a high degree of assurance that specific activity will consistenty produce a desired result or product meeting its predetermined specifications and quality characteristic, Method validation is an integral part of the method development; it is the process of demonstrating that analytical procedures are suitable for their intended use and that they support the identity, quality, purity, an and drug products. Simply, method validation is the process of proving that and potency of the drug substances analytical method is acceptable for its intended purpose. For chromatographic methods applications there is more consistency in validation practice with key analytical parameters (a)Recovery (b) Response function (c) Sensitivity (d) Presicion (e) Accuracy (f) limits of detection (g) Limit of quantitation (h) Ruggedness (i) Robustness (j) stability (k) system suitability A.Recovery: The absolute recovery of analytical method is measured as the response of a processed spiked matrix standard expressed as a percentage of the response of pure standard which has not been subjected to sample pre treatment and indicates whether the method provides a response for the entire amount of analyte that is present in the sample. Absolute recovery = Response of an analyte spike into matrix (processed) ------------------------------------------------------------ × 100 Response of analyte of pure standard (unprocessed) B.Sensitivity: The method is said to be sensitive if small changes in concentration cause large changes in response function. The sensitivity of an analytical method is determined from the slope of the calibration line. The limits of quantification (LOQ) or working dynamic range of bio analytical method are defined as the highest and lowest concentrations, which can determined with acceptable accuracy. It is suggested that, this be set at 15% for both the upper and lower limit of quantitation respectively. C.Precision: The purpose of carrying out a determination is to obtain a valid estimate of a ‘true’ value. When one considers the criteria according to which an analytical procedure is selected, precision and accuracy are usually the first time to come to mind. Precision and accuracy together determine the error of an individual determination. Precision refers to the reproducibility of measurement within a set, that is, to the scatter of dispersion of a set about its central value. The standard deviation S, is given by 1 multiplied by 100 and expressed as a percent relative standard deviation. It becomes a more reliable expression of precision. % Relative standard deviation = S x 100 / x D.Accuracy: Accuracy normally refers to the difference between the mean x****, of the set of results and the true or correct value for the quantity measured. According to IUPAC accuracy relates to the difference between results (or mean) and the true value. For analytical methods, there are two possible ways of determining the accuracy, absolute method and comparative method. used in analytical E.Limit of detection (LOD): The limit of detection (LOD) of an analytical method may be defined as the concentration, which gives rise to an instrument signal that is significantly different from the blank. For spectroscopic techniques or other methods that rely upon a calibration curve for quantitative measurements, the IUPAC approach employs the standard deviation of the intercept (Sa), which may be related to LOD and the slope of the calibration curve, b, by LOD = 3 Sa/ b F.Limit of quantitation (LOQ) The LOQ is the concentration that can be quantitate reliably with a specified level of accuracy and precision. The LOQ represent the concentration of analyte that would yield a signal-to-noise ratio of 10. LOQ = 10 Sa/ b Where, Sa- the estimate is the standard deviation of the peak area ratio of analyte to IS (5 injections) of the drugs. b -is slope of the corresponding calibration curve. G.Ruggedness Method Ruggedness is defined as the reproducibility of results when the method is performed under actual use conditions. This includes different analysts, laboratories, columns, instruments, source of reagents, chemicals, solvents etc.. H.Robustness The concept of robustness of an analytical procedure has been defined by the ICH as “a measure of its capacity to remain unaffected by small but deliberate variations in method parameters”. The robustness of a method is the ability to remain unaffected by small changes in parameters such as pH of the mobile phase, temperature, %organic solvent strength and buffer concentration etc I. System suitability System suitability experiments can be defined as tests to ensure that the method can generate results of acceptable accuracy and precision. The requirements for system suitability are usually developed after method development and validation have been completed. (or) The USP (2000) defines parameters that can be used to determine system suitability prior to analysis. n 2 x x i i n 1 1 S = The square of standard deviation is called variance (S2). Relative standard deviation is the standard deviation expressed as a fraction of the mean, i.e., S/x. It is sometimes @ IJTSRD | Unique Paper ID – IJTSRD28040 | Volume – 3 | Issue – 6 | September - October 2019 Page 75
International Journal of Trend in Scientific Research and Development (IJTSRD) @ www.ijtsrd.com eISSN: 2456-6470 MATERIALS And Method:-Chemicals: Acetonitrile HPLC Grade And Methanol Raw Material: Vortioxetine Working Standard. Instruments: HPLC – WATERS Model NO.2695 series Compact System Consisting of Inertsil-C18 ODS column. UV-Spectroscopy 1800 (Shimadzu) Electronic balance (SARTORIOUS) Digital pH meter(POLOMAN) Sonicator( FAST CLEAN) METHOD DEVELOPMENT FOR HPLC: The objective of this experiment was to optimize the assay method for estimation of Vortioxetine based on the literature survey made. So here the trials mentioned describes how the optimization was done. Observation: Got more chromatogram result was shown in Fig: Trail: 1. Mobile Phase: Methanol and Acetonitrile were mixed in the ratio of 80:20 V/V and sonicated to degas. Preparation of Standard Solution: 10mg of Vortioxetine drug was weighed and dissolved in 10ml of Mobile phase and taken in 10ml of volumetric flask and sonicated for 20 minutes to get 1000ppm and 1 ml. was taken from this and diluted to 10ml.with mobile phase hromatographicConditions: Flow rate : 1.0ml/min Column : Inertsil - C18 ODS column Detector wavelength : 274nm Column temp : Ambient Injection volume : 20µl Run time : 5min Retention time : 2.910 Observation: Got Bad Peak. The trial 3chromatogram result was shown in Fig:1 OPTIMIZED METHOD Mobile Phase: Acetonitrile and Methanol were taken and sonicated to degas in the ratio of 70:30. Preparation of stock solution: 10mg of Vortioxetine drug was weighed and dissolved in 10ml of Mobile phase and taken in 10ml of volumetric flask and sonicated for 20 minutes to get 1000ppm and 1ml. was taken from this and diluted to 10ml.with mobile phase. Preparation of working standard solution: The stock solution equivalent to 20ppm to 70ppm were prepared, sonicated and filtered through 0.45µ membrane. Optimized chromatographic conditions: Table no-1 Parameters Method Inertsil -ODS C18 (250 x 4.6 mm, packed with 5 micron) Acetonitrile and Methanol (70:30) 1.0 ml 6 Ambient Stationary phase (column) Mobile Phase Flow rate (ml/min) Run time (minutes) Column temperature (°C) Volume of injection loop (l) Detection wavelength (nm) 20 274nm 2.922 Drug RT (min) METHOD VALIDATION SYSTEM SUITABILITY: A Standard solution was prepared by using 10mg of Vortioxetine drug was weighed and dissolved in 10ml of Mobile phase and taken in 10ml of volumetric flask and sonicated for 20 minutes to get 1000ppm and 1 ml. was taken from this and diluted to 10ml.with mobile phase and was injected Five times into the HPLC system. The system suitability parameters were evaluated from standard chromatograms by calculating the % RSD from five replicate injections for Vortioxetine, retention times and peak areas. ACCEPTANCE CRITERIA: 1.The % RSD for the retention times of principal peak from 5 replicate injections of each Standard solution should be not more than 2.0 % 2.The % RSD for the peak area responses of principal peak from 5 replicate injections of each standard Solution should be not more than 2.0%. 3.The number of theoretical plates (N) for the Vortioxetine peaks is NLT 3000. 4.The Tailing factor (T) for the Vortioxetie peaks is NMT 2.0 OBSERVATION: The %RSD for retention times and peak areas were found to be within the limit.refer table: 5 As sown in Fig6 – 10. SPECIFICITY:- Vortioxetie identification: Solutions of standard and sample were prepared 10mg of Vortioxetine drug was weighed and dissolved in 10ml of Mobile phase and taken in 10ml of volumetric flask and sonicated for 20 minutes to get 1000ppm and 1 ml. was taken from this and diluted to 10ml.with mobile phase and injected into chromatographic system. ACCEPTENCE CRITERIA: Chromatogram of standard and sample should be identical with near Retention time. OBSERVATION: The chromatograms of Standard and Sample were same identical with same retention time. As shown in fig: 13 assymetry. The trial 2 @ IJTSRD | Unique Paper ID – IJTSRD28040 | Volume – 3 | Issue – 6 | September - October 2019 Page 76
International Journal of Trend in Scientific Research and Development (IJTSRD) @ www.ijtsrd.com eISSN: 2456-6470 PRECISION: Repeatability: A.System precision: Standard solution prepared 10mg of Vortioxetine drug was weighed and dissolved in 10ml of Mobile phase and taken in 10ml of volumetric flask and sonicated for 20 minutes to get 1000ppm and 1 ml. was taken from this and diluted to 10ml.with mobile phaseand injected five times. B.Method precision: Prepared six sample preparations individually using single as per above method and injected each solution. ACCEPTANCE CRITERIA: The % relative standard deviation of individual Vortioxetine, from the six units should be not more than 2.0%. The assay of Vortioxetine should be not less than 98% and not more than 102.0%. OBSERVATION: Test results are showing that the test method is precise. Refer tables:- 6 for system precision and for method precision. Intermediate precision 10mg of Vortioxetine drug was weighed and dissolved in 10ml of Mobile phase and taken in 10ml of volumetric flask and sonicated for 20 minutes to get 1000ppm and 1 ml. was taken from this and diluted to 10ml.with mobile phase.4 ml was taken from this diluted to 10 ml.with mobile phase. ACCEPTENCE CRITERIA: The individual assays of Vortioxetine should be not less than 98% and not more than 102% and %RSD of assay should be NMT2.0% by both analysts. OBSERVATION: Individual %assays and %RSD of Assay are within limit and passes the intermediate precision, Refer table: 8 ACCURACY (RECOVERY): A study of Accuracy was conducted. Drug Assay was performed in triplicate as 10mg of Vortioxetine drug was weighed and dissolved in 10ml of Mobile phase and taken in 10ml of volumetric flask and sonicated for 20 minutes to get 1000ppm and 1 ml. was taken from this and diluted to 10ml.with mobile phase with equivalent amount of F Vortioxetine into each volumetric flask for each spike level to get the concentration of f Vortioxetine equivalent to 50%, 100%, and 150% of the labeled amount as per the test method. The average % recovery of Vortioxetine was calculated. ACCEPTANCE CRITERIA: The mean % recovery of the Vortioxetine at each spike level should be not less than 98.0% and not more than 102.0%. OBSERVATION: Amount found %Recovery = ---------------------- × 100 Amount added The recovery results indicating that the test method has an acceptable level of accuracy. Refer table: 9 LINEARITY OF TEST METHOD: A Series of solutions are prepared using Vortioxetine working standard at concentration levels from 20ppm to 80 ppm of target concentration .Measure the peak area response of solution at Level 1 and Level 6 six times and Level 2 to Level 5 two times. ACCEPTANCE CRITERIA: Correlation Coefficient should be not less than 0.9990. % of y- Intercept should be ±2.0. % of RSD for level 1 and Level 6 should be not more than 2.0%. OBSERVATION: The linear fit of the system was illustrated graphically. The results are presented in table:4 ROBUSTNESS: Effect of variation of flow rate: A study was conducted to determine the effect of variation in flow rate. Standard solution prepared as per the test method was injected into the HPLC system using flow rates, 1.0ml/min and1.2ml/min. The systemsuitability parameters were evaluated and found to be within the limits for 1.0ml/min and 1.2ml/min flow. Vortioxetine was resolved from all other peaks and the retention times were comparable with those obtained for mobile phase having flow rates 1.0ml/min. ACCEPTANCE CRITERIA: The Tailing Factor of Vortioxetine standards should be NMT 2.0 for Variation in Flow. OBSERVATION: The tailing factor for MF was found to be within the limits. As shown in table 10. LIMIT OF DETECTION AND QUANTITATION (LOD and LOQ): From the linearity data calculate the limit of detection and quantitation, using the following formula. LOD = 3.3 σ σ = standard deviation of the response S = slope of the calibration curve of the analyte. LOQ = 10 S σ = standard deviation of the response S = slope of the calibration curve of the analyte. Method Development:- S @ IJTSRD | Unique Paper ID – IJTSRD28040 | Volume – 3 | Issue – 6 | September - October 2019 Page 77
International Journal of Trend in Scientific Research and Development (IJTSRD) @ www.ijtsrd.com eISSN: 2456-6470 0.030 2.910 0.025 0.020 0.015 AU 0.010 0.005 0.000 0.50 1.00 1.50 2.00 2.50 3.00 3.50 4.00 Minutes Fig1: Chromatogram of Trial Inference: Got Bad Peak. Table No-2 Sr. NO. Name of the peak Retention time(min) 1. VORTIOXETINE 2.910 OPTIMIZED METHOD Vortioxetie - 2.922 0.40 0.30 AU 0.20 0.10 0.00 0.50 1.00 1.50 2.00 2.50 3.00 3.50 4.00 4.50 5.00 5.50 6.00 Minutes Fig2: Chromatogram of standard 1 Inference: Got chromatogram at an Rt of 2.922for standard Table No-3 Sr. NO. Name of the peak Retention time(min) 1 VORTIOXETINE 2.922 Peak area 1115674.56 Tailing factor 1.014 VALIDATION DATA LINEARITY: TABLE No4: Data of Linearity Average Area 0 557827.45 836741.48 1115655.45 1381456.65 1673482.32 1952396.25 Concentration (ppm) 0 20 30 40 50 60 70 Statistical Analysis Slope y-Intercept Correlation Coefficient 27848 -214.8 0.999 Fig: 3 Linearity Plot (Concentration Vs Response) @ IJTSRD | Unique Paper ID – IJTSRD28040 | Volume – 3 | Issue – 6 | September - October 2019 Page 78
International Journal of Trend in Scientific Research and Development (IJTSRD) @ www.ijtsrd.com eISSN: 2456-6470 0.20 Vortioxetie - 2.921 0.15 AU 0.10 0.05 0.00 0.50 1.00 1.50 2.00 2.50 3.00 3.50 4.00 4.50 5.00 5.50 6.00 Minutes Fig: 4 Chromatograms for 20 ppm Inference: Chromatogram for 20 ppm 0.30 Vortioxetie - 2.922 0.25 0.20 AU 0.15 0.10 0.05 0.00 0.50 1.00 1.50 2.00 2.50 3.00 3.50 4.00 4.50 5.00 5.50 6.00 Minutes Fig: 5-6 chromatograms for 30ppm, 40 ppm Inference: Chromatogram for 30 ppm standard 1 Vortioxetie - 2.920 0.40 0.30 AU 0.20 0.10 0.00 0.50 1.00 1.50 2.00 2.50 3.00 3.50 4.00 4.50 5.00 5.50 6.00 Minutes Inference: Chromatogram for 40 ppm standard 1 0.50 Vortioxetie - 2.921 0.40 0.30 AU 0.20 0.10 0.00 0.50 1.00 1.50 2.00 2.50 3.00 3.50 4.00 4.50 5.00 5.50 6.00 Minutes Fig: 7-8 Chromatograms for 50 ppm, 60 ppm Inference: Chromatogram for 50 ppm standard 1 @ IJTSRD | Unique Paper ID – IJTSRD28040 | Volume – 3 | Issue – 6 | September - October 2019 Page 79
International Journal of Trend in Scientific Research and Development (IJTSRD) @ www.ijtsrd.com eISSN: 2456-6470 0.60 Vortioxetie - 2.920 0.50 0.40 0.30 AU 0.20 0.10 0.00 0.50 1.00 1.50 2.00 2.50 3.00 3.50 4.00 4.50 5.00 5.50 6.00 Minutes Inference: Chromatogram for 60 ppm standard 1 Vortioxetie - 2.920 0.60 0.40 AU 0.20 0.00 0.50 1.00 1.50 2.00 2.50 3.00 3.50 4.00 4.50 5.00 5.50 6.00 Minutes Inference: Chromatogram for 70 ppm standard 1 SYSTEM SUITABILITY: TABLE No-5: Data of System Suitability RT Peak Area 2.921 1115623.12 2.920 1115684.35 2.920 1115601.99 2.922 1115674.56 2.923 1115688.56 2.921231 1115654.51 0.001303 39.3557 0.04460 0.00352 Injection 1 2 3 4 5 Mean SD % RSD USP Plate count USP Tailing 11035 11042 11054 11038 11045 11042 ------- ------- 1.012 1.016 1.023 1.014 1.019 1.016 ------- ------- Vortioxetie - 2.921 0.40 0.30 AU 0.20 0.10 0.00 0.50 1.00 1.50 2.00 2.50 3.00 3.50 4.00 4.50 5.00 5.50 6.00 Minutes Fig: 9-13 Chromatograms of system suitability(standards 1-5) Inference: System suitability Chromatogram for standard – 1 Vortioxetie - 2.920 0.40 0.30 AU 0.20 0.10 0.00 0.50 1.00 1.50 2.00 2.50 3.00 3.50 4.00 4.50 5.00 5.50 6.00 Minutes Inference: System suitability Chromatogram for standard – 2 @ IJTSRD | Unique Paper ID – IJTSRD28040 | Volume – 3 | Issue – 6 | September - October 2019 Page 80
International Journal of Trend in Scientific Research and Development (IJTSRD) @ www.ijtsrd.com eISSN: 2456-6470 Vortioxetie - 2.920 0.40 0.30 AU 0.20 0.10 0.00 0.50 1.00 1.50 2.00 2.50 3.00 3.50 4.00 4.50 5.00 5.50 6.00 Minutes Inference: System suitability Chromatogram for standard – 3 Vortioxetie - 2.922 0.40 0.30 AU 0.20 0.10 0.00 0.50 1.00 1.50 2.00 2.50 3.00 3.50 4.00 4.50 5.00 5.50 6.00 Minutes Inference: System suitability Chromatogram for standard - 4 Vortioxetie - 2.923 0.40 0.30 AU 0.20 0.10 0.00 0.50 1.00 1.50 2.00 2.50 3.00 3.50 4.00 4.50 5.00 5.50 6.00 Minutes Inference: System suitability Chromatogram for standard - 5 SPECIFICITY: Vortioxetie - 2.923 0.40 0.30 AU 0.20 0.10 0.00 0.50 1.00 1.50 2.00 2.50 3.00 3.50 4.00 4.50 5.00 5.50 6.00 Minutes Fig14: Chromatogram of standard Inference: Got a peak for standard at an Rt of 2.923 PRECISION: Repeatability: A.system precision: TABLE No -6 Data of Repeatability (System precision) Injection 1 2 3 4 5 Mean SD % RSD Peak Areas of Vortioxetine 1115589.45 1115601.05 1115596.58 1115608.89 1115582.65 1115595.72 10.1579 0.00091 %Assay 100.16 100.17 100.16 100.17 100.16 100.16 0.00091 0.00091 Concentration 40ppm Statistical Analysis @ IJTSRD | Unique Paper ID – IJTSRD28040 | Volume – 3 | Issue – 6 | September - October 2019 Page 81
International Journal of Trend in Scientific Research and Development (IJTSRD) @ www.ijtsrd.com eISSN: 2456-6470 Vortioxetie - 2.921 0.40 0.30 AU 0.20 0.10 0.00 0.50 1.00 1.50 2.00 2.50 3.00 3.50 4.00 4.50 5.00 5.50 6.00 Minutes Fig15-19 Chromatograms of system precision Inference: Chromatogram for system precision (standard - 1) Vortioxetie - 2.920 0.40 0.30 AU 0.20 0.10 0.00 0.50 1.00 1.50 2.00 2.50 3.00 3.50 4.00 4.50 5.00 5.50 6.00 Minutes Inference: Chromatogram for system precision (standard - 2) Vortioxetie - 2.920 0.40 0.30 AU 0.20 0.10 0.00 0.50 1.00 1.50 2.00 2.50 3.00 3.50 4.00 4.50 5.00 5.50 6.00 Minutes Inference: Chromatogram for system precision (standard - 3) Vortioxetie - 2.921 0.40 0.30 AU 0.20 0.10 0.00 0.50 1.00 1.50 2.00 2.50 3.00 3.50 4.00 4.50 5.00 5.50 6.00 Minutes Inference: Chromatogram for system precision (standard - 4) Vortioxetie - 2.920 0.40 0.30 AU 0.20 0.10 0.00 0.50 1.00 1.50 2.00 2.50 3.00 3.50 4.00 4.50 5.00 5.50 6.00 Minutes Inference: Chromatogram for system precision (standard - 5) @ IJTSRD | Unique Paper ID – IJTSRD28040 | Volume – 3 | Issue – 6 | September - October 2019 Page 82
International Journal of Trend in Scientific Research and Development (IJTSRD) @ www.ijtsrd.com eISSN: 2456-6470 B.Method precision: TABLE No -7 Data of Repeatability (Method precision) Injection Peak Areas of Vortioxetine %Assay 1 1115568.87 2 1115590.63 3 1115579.42 4 1115601.55 5 1115595.45 6 1115610.62 Mean 1115591.09 SD 15.09947 % RSD 0.001353 100.16 100.16 100.16 100.17 100.16 100.17 100.16 0.00135 0.00135 Concentration 40ppm Statistical Analysis Vortioxetie - 2.920 0.40 0.30 AU 0.20 0.10 0.00 0.50 1.00 1.50 2.00 2.50 3.00 3.50 4.00 4.50 5.00 5.50 6.00 Minutes Fig: 20-24 Chromatograms of Repeatability Inference: Chromatogram for Repeatability (standard - 1) Vortioxetie - 2.922 0.40 0.30 AU 0.20 0.10 0.00 0.50 1.00 1.50 2.00 2.50 3.00 3.50 4.00 4.50 5.00 5.50 6.00 Minutes Inference: Chromatogram for Repeatability (standard -2) V ortioxetie - 2.923 0.40 0.30 AU 0.20 0.10 0.00 0.50 1.00 1.50 2.00 2.50 3.00 3.50 4.00 4.50 5.00 5.50 6.00 Minutes Inference: Chromatogram for Repeatability (standard - 3) Vortioxetie - 2.921 0.40 0.30 AU 0.20 0.10 0.00 0.50 1.00 1.50 2.00 2.50 3.00 3.50 4.00 4.50 5.00 5.50 6.00 Minutes Inference: Chromatogram for Repeatability (standard - 4) @ IJTSRD | Unique Paper ID – IJTSRD28040 | Volume – 3 | Issue – 6 | September - October 2019 Page 83
International Journal of Trend in Scientific Research and Development (IJTSRD) @ www.ijtsrd.com eISSN: 2456-6470 Vortioxetie - 2.919 0.40 0.30 AU 0.20 0.10 0.00 0.50 1.00 1.50 2.00 2.50 3.00 3.50 4.00 4.50 5.00 5.50 6.00 Minutes Inference: Chromatogram for Repeatability (standard - 5) Intermediate precision: Table No-8 Data of Intermediate precision Injection Peak Areas of Vortioxetine 1 2 3 4 5 6 Mean SD % RSD %Assay 100.16 100.16 100.17 100.17 100.17 100.17 100.17 0.001720 0.001717 1115593.56 1115568.95 1115599.15 1115602.08 1115618.45 1115622.12 1115600.71 19.16885 0.001718 Concentration 40ppm Statistical Analysis Vortioxetie - 2.919 0.40 0.30 AU 0.20 0.10 0.00 0.50 1.00 1.50 2.00 2.50 3.00 3.50 4.00 4.50 5.00 5.50 6.00 Minutes Fig: 25-26Chromatograms of Intermediate precision Inference: Chromatogram for IntermediatePrecision 0.40 Vortioxetie - 2.922 0.30 AU 0.20 0.10 0.00 0.50 1.00 1.50 2.00 2.50 3.00 3.50 4.00 4.50 5.00 5.50 6.00 Minutes Inference: Chromatogram for Intermediate Precision ACCURACY (RECOVERY) TABLE No -9 Data of Accuracy Concentration (40ppm) % of spiked level (ppm) 50%Sample 1 557853.51 50% Sample 2 557823.48 50% Sample 3 557860.56 100 %Sample 1 1115601.96 100 % Sample 2 1115580.45 100% Sample 3 1115620.56 150% Sample 1 1673484.25 150% Sample 2 1673482.12 150% Sample 3 1673476.85 Amount added Amount found (ppm) 20.03 20.03 20.04 40.06 40.06 40.06 60.10 60.10 60.10 Statistical Analysis of % Recovery MEAN %RSD MEAN %RSD MEAN %RSD Peak Area % Recovery 20 20 20 40 40 40 60 60 60 100.19 100.19 100.19 100.16 100.17 100.17 100.16 100.16 100.16 100.19 0.00352 100.17 0.00179 100.16 0.00022 @ IJTSRD | Unique Paper ID – IJTSRD28040 | Volume – 3 | Issue – 6 | September - October 2019 Page 84
International Journal of Trend in Scientific Research and Development (IJTSRD) @ www.ijtsrd.com eISSN: 2456-6470 0.20 Vortioxetie - 2.921 0.15 AU 0.10 0.05 0.00 0.50 1.00 1.50 2.00 2.50 3.00 3.50 4.00 4.50 5.00 5.50 6.00 Minutes Fig: 27-28Chromatograms for accuracy (50%) Inference: Chromatogram for standard 1 Vortioxetie - 2.922 0.20 0.15 AU 0.10 0.05 0.00 0.50 1.00 1.50 2.00 2.50 3.00 3.50 4.00 4.50 5.00 5.50 6.00 Minutes Inference: Chromatogram for standard 2 Vortioxetie - 2.921 0.40 0.30 AU 0.20 0.10 0.00 0.50 1.00 1.50 2.00 2.50 3.00 3.50 4.00 4.50 5.00 5.50 6.00 Minutes Fig: 29-30- Chromatograms for accuracy (100%) Inference: Chromatogram for standard 1 Vortioxetie - 2.920 0.40 0.30 AU 0.20 0.10 0.00 0.50 1.00 1.50 2.00 2.50 3.00 3.50 4.00 4.50 5.00 5.50 6.00 Minutes Inference: Chromatogram for standard 2 0.60 Vortioxetie - 2.920 0.50 0.40 0.30 AU 0.20 0.10 0.00 0.50 1.00 1.50 2.00 2.50 3.00 3.50 4.00 4.50 5.00 5.50 6.00 Minutes Fig: 31-32 chromatograms For Accuracy (150%) Inference: Chromatogram for standard 1 @ IJTSRD | Unique Paper ID – IJTSRD28040 | Volume – 3 | Issue – 6 | September - October 2019 Page 85
International Journal of Trend in Scientific Research and Development (IJTSRD) @ www.ijtsrd.com eISSN: 2456-6470 0.60 Vortioxetie - 2.923 0.50 0.40 AU 0.30 0.20 0.10 0.00 0.50 1.00 1.50 2.00 2.50 3.00 3.50 4.00 4.50 5.00 5.50 6.00 Minutes Inference: Chromatogram for standard Robustness: TABLE No-10 Data for Effect of variation in flow rate: Std Area 1108456.25 1108444.66 1108471.52 1108462.59 1108473.19 Avg 1108461.64 SD 11.71848 %RSD 0.00105 A.Effect of variation of flow rate (for 0.8 ml/min flow) Tailing factor 1.111 1.115 1.117 1.121 1.123 1.117 0.0047 0.4273 Tailing factor 1.115 1.117 1.115 1.116 1.117 1.116 0.001 0.0896 Tailing factor 1.128 1.130 1.129 1.129 1.128 1.129 0.0008 0.0741 Std Area Std Area 1115647.14 1115632.32 1115639.64 1115621.35 1115611.54 1115630.39 14.2029 0.00127 1123864.24 1123888.46 1123878.23 1123845.16 1123854.54 1123866.12 17.4834 0.00155 Flow 0.8 ml Flow 1.0 ml Flow 1.2 ml Avg SD %RSD Avg SD %RSD Vortioxetie - 3.263 0.40 0.30 AU 0.20 0.10 0.00 0.50 1.00 1.50 2.00 2.50 3.00 3.50 4.00 4.50 5.00 5.50 6.00 Minutes Fig: 33-34 Chromatograms of robustness Inference: Chromatogram for robustness standard – 1 Vortioxetie - 3.261 0.40 0.30 AU 0.20 0.10 0.00 0.50 1.00 1.50 2.00 2.50 3.00 3.50 4.00 4.50 5.00 5.50 6.00 Minutes Inference: Chromatogram for robustness standard – 2 Fig: 35-36 chromatograms for 1ml/min Vortioxetie - 2.920 0.40 0.30 AU 0.20 0.10 0.00 0.50 1.00 1.50 2.00 2.50 3.00 3.50 4.00 4.50 5.00 5.50 6.00 Minutes Inference: Chromatogram for robustness standard – 1 @ IJTSRD | Unique Paper ID – IJTSRD28040 | Volume – 3 | Issue – 6 | September - October 2019 Page 86
International Journal of Trend in Scientific Research and Development (IJTSRD) @ www.ijtsrd.com eISSN: 2456-6470 Vortioxetie - 2.922 0.40 0.30 AU 0.20 0.10 0.00 0.50 1.00 1.50 2.00 2.50 3.00 3.50 4.00 4.50 5.00 5.50 6.00 Minutes Inference: Chromatogram for robustness standard – 2 0.40 Vortioxetie - 2.651 0.30 AU 0.20 0.10 0.00 0.50 1.00 1.50 2.00 2.50 3.00 3.50 4.00 4.50 5.00 5.50 6.00 Minutes Fig: 37-38 Chromatograms for 1.2ml/min Inference: Chromatogram for robustness standard – 1 0.40 Vortioxetie - 2.649 0.30 AU 0.20 0.10 0.00 0.50 1.00 1.50 2.00 2.50 3.00 3.50 4.00 4.50 5.00 5.50 6.00 Minutes Inference: Chromatogram for robustness standard – 2 LIMIT OF DETECTION AND LIMIT OF QUANTITATION (LOD and LOQ) From the linearity plot the LOD and LOQ are calculated: - LOD= 3.3 σ S 3.3×39.5337 = ------------------ =0.00468 27848 LOQ = 10 σ S 10×39.5337 = --------- = 0.0141 27848 Summary and conclusion The analytical method was developed by studying different parameters. First of all, maximum absorbance was found to be at 274nm and the peak purity was excellent. Injection volume was selected to be 20µl which gave a good peak area. The column used for study was Inertsil C18 chosen good peak shape. Ambient temperature was found to be suitable for the nature of drug solution. The flow rate was fixed at 1.0ml/min because of good peak area and satisfactory retention time. Different pH and ratios of mobile phase were studied, mobile phase with ratio of Acetonitrile and Methanol (70: 30) was fixed due to good symmetrical peak. So this mobile phase was used for the proposed study. Methanol was selected because of maximum extraction sonication time was fixed to be 10min at which all the drug particles were completely soluble and showed good recovery. Retention time is 2.922 . The present recovery was found to be 98.0-102 was linear and precise over the same range. Both system and method precision was found to be accurate and well within range. Detection limit was found to be 0.00468. Linearity study was, correlation coefficient and curve fitting was found to be. The analytical method was found linearity over the range of 10-70ppm of the target concentration. The method was found accuracy,precise,economical and reproducible. So the propose method can be used for the routine quality control analysis of Vortioxetine in bulk and dosage form. to be simple, @ IJTSRD | Unique Paper ID – IJTSRD28040 | Volume – 3 | Issue – 6 | September - October 2019 Page 87
International Journal of Trend in Scientific Research and Development (IJTSRD) @ www.ijtsrd.com eISSN: 2456-6470 REFERENCES: - [1]https://www.drug.com/cdi/vortioxetine.html. [14]Satish Ramanathan Velamakanni A Novel LC-MS/MS Method for Quantification of Vortioxetine in Human Plasma and Its Application to Pharmacokinetics Studies. [2]Snyder LR practical HPLC method development,2 nd edition john and sons, New York(1997), PP 180-182 [15]Willard, H. Y. Merritt L. L Dean J. A and Settle F. A “ Instrumental method of analysis ’’7 th edition CBS Publisher and distributors, New Delhi,(1991)PP 436- 439 [3]Skoog D A, West D M, Holler FJ: Introduction of analytical chemistry .Sounder College of Publishing, Harcourt Brace College publisher .(1994),PP 1-5. [4]Sharma B K Instrumental Method Of Chemical analysis Meerut (1999),PP 175-203 [16]Breaux J and Jones K: Understanding and implementing efficient analytical method development and validation .Journal of Pharmaceutical Technology (2003) PP 110-114 [5]Breaux J and Jones K: Understanding and implementing efficient analytical method development and validation .Journal of Pharmaceutical Technology (2003), PP 110-114. [17]Sharma B K, Instrumental method of chemical analysis Meerut .(1999) PP 175-203 [6]Willard, H.Y .Merritt L. L, Dean J.A and Settle F.A “Instrumental method of analysis’’7 th edition CBS publisher and distrubutors, New Delhi (1991),PP 436- 439. [18]Pravallika K e, Ravi P, Abboodi A H, Razzaq A H, Sassivardhan O .Development and validation of UV Spectrophotometric methods for the estimation of Vortioxetine hydrobromide in Bulk and Pharmaceutical dosage forms .Research J. Pharm and Tech,2017; (11): 3928-3932.6 ICH Q2A “Validation of analytical methods, Defination and terminology ’’, ICH Harmonized tripartite guideline,(1999) [7]ICH Q2A “Validation of analytical method, definitions and terminology ’’, ICH Hamonized tripartite guideline,(1999). [8]Code Q2B Validation of Analytical Procedures; Methodology .ICH Harmonized tripartite guidelines, Geneva Switzerland,(1996),PP 1-8. [19]Guilloux J P, Mendez –David I,Pehrson A Guiard BP, Reperant C, Orvoen S. Antidepressant and anxiolytic potential of the multimodal Vortioxetine assessd by behavioural and neurogenesis outcomes in mice .Neuropsychopharmacol 2013;73(2): 147-159 antidepressant [9]Reference Book of Principal of Industrial analysis by skoog, Holler Nieman. [10]Reference Book of Practical Pharmaceutical analysis by Devala Rao .G [20]ICH Guideline, Validation of Analytical Procedure, Text And Methodology Guideline,2005Page no5 -17 Q2(R1); I.C.H Tripathi [11]Text Book of Pharmacy analysis by Chatwal Anand. [12]Rubeena Sultana, K Rajeshwar Dutt, R. Vasanthi, M. Alagar Raja, K. N. Rao Validated RP-HPLC Method for The Estimation of Vortioxetine in Bulk and Tablet. [21]sharma B. K, Instrumental Method of Chemical Analysis 21 Edition. Goel Publishing housing 2002 ; Page no- 3,10,133,161,68-80,114-165 [13]Michal Dousa Jan Doubsky jan srbek, Utilisation of Photochemically Induced Fluorescence Detection for HPLC Determination of Genotoxic impurities in the Vortioxetine Manufacturing Process . [22]G Chatwal S Anand Instrumental of Chemical Analysis ; Goel Publishers, New Delhi,2003;page no-2.625 @ IJTSRD | Unique Paper ID – IJTSRD28040 | Volume – 3 | Issue – 6 | September - October 2019 Page 88