Download
1 / 7
90 likes | 166 Vues
RP-HPLC method has been developed and validated for quantitative determination of Aprepitant in bulk and<br>pharmaceutical dosage forms. All the parameters of the drug met the criteria of ICH guidelines for method<br>validation. The method is very simple, rapid and economic in nature as the peak is well suitable for routine quality<br>control analysis work. Agilent Polaris ODS C18 (150 X 4.6 cm 5µm) column is used. Mobile phase composition<br>consisted of (80:20 v/v) of Methanol and 10mM Sodium acetate (pH adjusted to 3.0 ± 0.1 with glacial ac etic acid)<br>on isocratic mode. The flow rate of the method is 1.0 ml/min. The retention time of the drug is 4.40 minutes.<br>Calibration standards were prepared in the concentration range of 2.53 to 50.57µg/ml. The wavelength of detection<br>is 210nm. The column temperature is maintained at 25 0C. Several modifications in the mobile phase composition<br>were made in order to study the possibilities of changing the selectivity of the chromatographic system. These<br>modifications included the change of the type and ratio of the organic modifier, pH, flow rate, temperature and<br>stability of Aprepiitant also studied in various stress conditions.

E N D
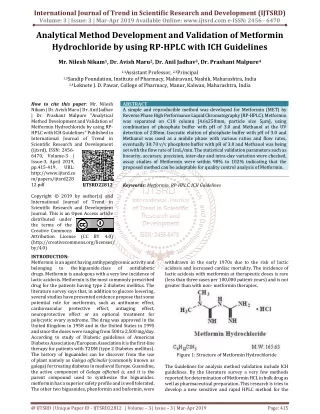
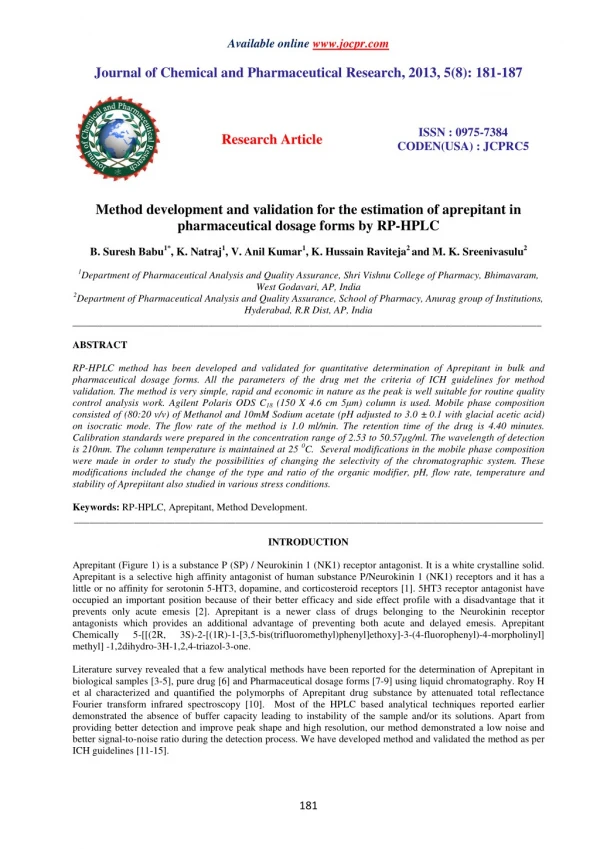
Available online www.jocpr.com Journal of Chemical and Pharmaceutical Research, 2013, 5(8): 181-187 ISSN : 0975-7384 CODEN(USA) : JCPRC5 Research Article Method development and validation for the estimation of aprepitant in pharmaceutical dosage forms by RP-HPLC B. Suresh Babu1*, K. Natraj1, V. Anil Kumar1, K. Hussain Raviteja2 and M. K. Sreenivasulu2 1Department of Pharmaceutical Analysis and Quality Assurance, Shri Vishnu College of Pharmacy, Bhimavaram, West Godavari, AP, India 2Department of Pharmaceutical Analysis and Quality Assurance, School of Pharmacy, Anurag group of Institutions, Hyderabad, R.R Dist, AP, India _____________________________________________________________________________________________ ABSTRACT RP-HPLC method has been developed and validated for quantitative determination of Aprepitant in bulk and pharmaceutical dosage forms. All the parameters of the drug met the criteria of ICH guidelines for method validation. The method is very simple, rapid and economic in nature as the peak is well suitable for routine quality control analysis work. Agilent Polaris ODS C18 (150 X 4.6 cm 5µm) column is used. Mobile phase composition consisted of (80:20 v/v) of Methanol and 10mM Sodium acetate (pH adjusted to 3.0 ± 0.1 with glacial acetic acid) on isocratic mode. The flow rate of the method is 1.0 ml/min. The retention time of the drug is 4.40 minutes. Calibration standards were prepared in the concentration range of 2.53 to 50.57µg/ml. The wavelength of detection is 210nm. The column temperature is maintained at 25 0C. Several modifications in the mobile phase composition were made in order to study the possibilities of changing the selectivity of the chromatographic system. These modifications included the change of the type and ratio of the organic modifier, pH, flow rate, temperature and stability of Aprepiitant also studied in various stress conditions. Keywords: RP-HPLC, Aprepitant, Method Development. _____________________________________________________________________________________________ INTRODUCTION Aprepitant (Figure 1) is a substance P (SP) / Neurokinin 1 (NK1) receptor antagonist. It is a white crystalline solid. Aprepitant is a selective high affinity antagonist of human substance P/Neurokinin 1 (NK1) receptors and it has a little or no affinity for serotonin 5-HT3, dopamine, and corticosteroid receptors [1]. 5HT3 receptor antagonist have occupied an important position because of their better efficacy and side effect profile with a disadvantage that it prevents only acute emesis [2]. Aprepitant is a newer class of drugs belonging to the Neurokinin receptor antagonists which provides an additional advantage of preventing both acute and delayed emesis. Aprepitant Chemically 5-[[(2R, 3S)-2-[(1R)-1-[3,5-bis(trifluoromethyl)phenyl]ethoxy]-3-(4-fluorophenyl)-4-morpholinyl] methyl] -1,2dihydro-3H-1,2,4-triazol-3-one. Literature survey revealed that a few analytical methods have been reported for the determination of Aprepitant in biological samples [3-5], pure drug [6] and Pharmaceutical dosage forms [7-9] using liquid chromatography. Roy H et al characterized and quantified the polymorphs of Aprepitant drug substance by attenuated total reflectance Fourier transform infrared spectroscopy [10]. Most of the HPLC based analytical techniques reported earlier demonstrated the absence of buffer capacity leading to instability of the sample and/or its solutions. Apart from providing better detection and improve peak shape and high resolution, our method demonstrated a low noise and better signal-to-noise ratio during the detection process. We have developed method and validated the method as per ICH guidelines [11-15]. 181
B. Suresh Babu et al ______________________________________________________________________________ J. Chem. Pharm. Res., 2013, 5(8): 181-187 Figure 1: Structure of Aprepitant EXPERIMENTAL SECTION Instrumentation and Chromatographic Condition: The Chromatographic system consisted of a Shimadzu Class VP Binary pump LC-10ATvp, SIL-10ADvp Auto sampler, CTO-10Avp Column Temperature Oven, SPD-10Avp UV-Visible Detector. All the components of the system are controlled using SCL-10Avp System Controller. Data acquisition was done using LC Solutions software. The mobile phase consisted of 80:20 % (v/v) of Methanol & 10mM Sodium Acetate (pH adjusted to 3.0 with acetic acid) operated on isocratic mode. The flow rate is 1.0 ml/min. Chromatographic determination of Aprepitant was performed on Agilent Polaris C18 column (150 X 4.6 mm id, ODS 2, 5µm). The wavelength of detection is 210 nm. A typical chromatogram showing the separation of Aprepitant is presented in Figure 2. The retention time of Aprepitant is 4.40 min. The injection volume is 20µL. Chemicals and Solvents: Sodium Acetate (AR Grade, SD Fine Chem. ltd), Methanol (HPLC grade, Merck ltd), Milli-Q water, Aprepitant (Reference standard purchased from Sigma Aldrich, USA), Acetic Acid (GR Grade, SD Fine Chem. Ltd). EMEND is the pharmaceutical dosage with 80 mg of Aprepitant manufactured by Merck & Co. All other chemicals are of the highest grade commercially available unless otherwise specified. Preparation of standard solutions, Calibration Standards & Quality Control Samples: Stock solutions of Aprepitant (5mg/ml) was prepared separately in a volumetric flask and labeled accordingly. Suitable dilutions of Aprepitant were prepared using 50:50 %v/v Methanol & Milli-Q water as diluent Solution. A Linear Calibration curve containing 8 non-zero standards were prepared using diluent solution in the concentration range of 2.53 – 50.57 µg/ml. The linear standard calibration standard sample is then transferred into the auto sampler for analysis. Samples for Specificity (Sample with Drug; Blank Sample were also prepared accordingly). For the preparation of quality control samples, a separate stock containing approximately the same concentration of the drug substance is prepared and labeled as quality control stock. From this stock, quality control samples were prepared at three concentration levels namely LQC (12.640 µg/ml), MQC (25.290 µg/ml), HQC (37.93 µg/ml) so as to obtain low, median and high concentration quality control samples. The performance of the linear calibration curve is then evaluated using quality control samples Preparation of Buffer Solution: 10mM sodium acetate buffer: Dissolve 136.1 g of sodium acetate in sufficient water to produce 1000 ml of 10 mM Sodium acetate. The pH of the solution is then adjusted to 3.0 ± 0.1 with glacial acetic acid. The solution is labeled and used within 3 days from the date of preparation. Preparation of Mobile Phase: 80 parts of methanol is mixed with 20 parts of 10mM sodium acetate buffer to obtain 80:20 % (v/v) of Methanol and 10 mM Sodium Acetate Buffer. The mixture is mixed well, sonicated in an ultrasonic bath for 20 minutes and then used for the experiment. The solution is labeled and used within 7 days from the date of preparation. Preparation of Diluent Solution: 50 parts of methanol is mixed with 50 parts of Milli-Q water to obtain 50:50 % (v/v) of Methanol and water. The mixture is mixed well, sonicated in an ultrasonic bath for 20 minutes and then used for the experiment. The solution is labeled and used within 7 days from the date of preparation. 182
B. Suresh Babu et al ______________________________________________________________________________ J. Chem. Pharm. Res., 2013, 5(8): 181-187 Figure 2: Typical chromatogram showing the separation of Aprepitant Linearity and Construction of Calibration Curve: Linearity of the peak area response was determined by taking six replicate measurements at eight concentration points. Calibration curve solutions for Aprepitant in the range of 2.53, 5.06, 10.11, 20.23, 30.34, 40.46, 44.25, 50.57µg/ml were prepared by taking suitable dilutions of the standard solutions in different 10 ml volumetric flasks and diluted up to the mark with the mobile phase. The drug in the eluents was monitored at 210 nm and the corresponding chromatograms were obtained. From the chromatograms, the mean peak areas were constructed. The regression of the plot was computed by least square method. A linear relationship between concentration Vs peak area response was established within the above range of calibration curve. This regression equation was later used to estimate the amount of Aprepitant in pharmaceutical dosage forms. The linearity plot was shown in the Figure 3 and the statistical parameters for the linearity plot are reported in Table1. 2500000 y = 43163x + 5141. R² = 0.999 2000000 1500000 Series1 1000000 Linear (Series1) 500000 0 0.00 20.00 40.00 60.00 Figure 3: Linearity plot of Aprepitant Parameter Linearity range [µg/ml] Slope Intercept Correlation coeffcient Regression equation Value 2.53 – 50.57 µg/ml 43163 +5141 0.999 Y=43163x + 5141 Table 1: Regression characteristics of the linearity plot of Aprepitant Validation of the Proposed Method: Specificity: The method specificity was assessed by comparing the chromatogram obtained from the drug with those obtained from the blank solution. The blank solution was prepared by mixing the excipitents in the blank solutions. The blank solutions were prepared by mixing the excipitents in the mobile phase without drug. The drug to excipitent ratio used was similar to that in the commercial formulations like lactose, starch, microcrystalline cellulose, ethyl 183
B. Suresh Babu et al ______________________________________________________________________________ J. Chem. Pharm. Res., 2013, 5(8): 181-187 cellulose, hydroxyl propyl methyl cellulose, magnesium stearate and colloidal silicon dioxide were used for the study. The mixtures were filtered through 0.45 µ membrane filter before injection. An observation of the chromatograms indicates absence of excipitent peaks near the drug in the study run time. This indicates that the method is specific. Precision: Precision is the degree of repeatability of an analytical method under normal operational conditions. The precision of the method was studied in terms of repeatability (intra-day assay) and intermediate precision (inter-day assay). Method repeatability was studied by repeating the assay three times in the same day for intra -day precision and intermediate precision was studied by repeating the assay on three different days, three times on each day (inter-day precision). The intra-day and inter-day variation for determination of Aprepitant was carried out at three different concentration levels. % RSD values are presented in the Table 2. Accuracy: Accuracy of the method was evaluated by standard addition method. An amount of the pure drug at three different concentration levels in its solution has been added to the pre analysed working standard of the drug. The sample solutions were analysed in triplicate at each level as per the proposed method. The percent individual recovery and % RSD for recovery at each level are calculated. The results are tabulated in Table 2. A recovery ranged from 98.00- 102.00% has been obtained by the method indicates its accuracy. Sample ID Nominal Concentration (µg/ml) DAY 1 Mean Concentration (µg/ml) SD % RSD % Recovery DAY 2 Mean Concentration (µg/ml) SD % RSD % Recovery DAY 3 Mean Concentration (µg/ml) SD % RSD % Recovery Table 2. Results of inter and intra-day accuracy & precision (% RSD) for Aprepitant Robustness: A study was conducted to determine the effect of variations in the optimized chromatographic conditions like composition of the mobile phase and flow rate of the mobile phase. The effect of these changes on the system suitability parameters like tailing factor and number of theoretical plates and on assay was studied. A single condition was varied at a time keeping all other parameters constant. The results were found to be within the allowed limits which indicate that the method is robust. The results of robustness are shown in Table 3. i)Variations in composition of the mobile phase The effect of variation in percent organic content in mobile phase was evaluated by changing the composition of organic component in mobile phase. The tailing factor and the number of theoretical plates showed a little change in mobile phase composition. ii)Variations in flow rate A study was conducted to determine the effect of variation in flow rate. The system suitability parameters were evaluated at 1.1 ml/min and 0.9 ml/min. Parameters Variation 0.9 mL/min 1.1 mL/min 75% organic phase 85% organic phase Table 3: Results of Robustness study LQC 12.64 MQC 25.29 HQC 37.93 12.42 0.09 0.76 98.25 25.24 0.04 0.16 99.80 38.66 0.05 0.14 101.92 12.47 0.06 0.48 98.65 25.51 0.08 0.31 100.86 38.32 0.07 0.18 101.02 12.29 0.11 0.90 97.23 25.16 0.09 0.36 99.48 37.32 0.07 0.19 98.39 Rt 4.65 3.8 6.49 3.1 Tailing factor 1.32 1.30 1.18 1.59 Peak area 1161051 924039 1146325 1121185 Flow rate Mobile phase 184
B. Suresh Babu et al ______________________________________________________________________________ J. Chem. Pharm. Res., 2013, 5(8): 181-187 Stability of the Analytical Solution: The stability of the drug is determined by placing the MQC samples for the short term stability by keeping at room temperature up to 12 hours and then comparing the obtained peak area with that of the similarly prepared fresh sample. Further, auto-sampler stability for up to 24 hrs was studied and established. Room Temperature Stability Stability studies were done for short term stability up to 12 hrs on the bench top for the MQC levels conditions. Stability is calculated as the ratio of the mean peak area of the stability sample to the mean peak area of the fresh sample and expressed as the percentage (n=6). The room temperature stability was found to be 105.61 %. The results are fresh and stable samples are in tabulated in Table 4 and 5. FRESH SAMPLE Sr. No SAMPLE ID DRUG PEAK AREA 1008932 994183 1023586 1033464 1028296 1010603 1024121.00 11988.72 1.17 RT 4.23 4.23 4.24 4.24 4.24 4.26 1 2 3 4 5 6 FRESH SAMPLE FRESH SAMPLE FRESH SAMPLE FRESH SAMPLE FRESH SAMPLE FRESH SAMPLE MEAN SD % RSD Table 4: Fresh samples of Aprepitant (n = 6) STABILITY SAMPLE Sr. No SAMPLE ID DRUG PEAK AREA 1085534 1081145 1045241 1063244 1091932 1089402 1081526.00 15883.13 1.47 RT 4.25 4.27 4.28 4.28 4.29 4.30 1 2 3 4 5 6 STABILITY SAMPLE STABILITY SAMPLE STABILITY SAMPLE STABILITY SAMPLE STABILITY SAMPLE STABILITY SAMPLE MEAN SD % RSD Table 5: Stability samples of Aprepitant (n = 6) Limit of Detection and Limit of Quantification Limit of detection (LOD) is defined as the lowest concentration of analyte that gives a measurable response. LOD is determined based on signal to noise ratio (S/N) of three times typically for HPLC methods. The limit of quantification (LOQ) is defined as the lowest concentration that can be quantified reliably with a specified level of accuracy and precision. It is the lowest concentration at which the precision expressed by a RSD of less than 2%. In this study the analyte response is 10 times greater than the noise response. For this study, six replicates of the analyte at lowest concentration in the calibration range were measured and quantified. The results of LOD and LOQ are tabulated in Table 6 and 7. LOD SR NO Retention Time 1 4.28 2 4.28 3 4.28 MEAN 4.3 ST DEV 0.00 % CV 0.00 Table 6: LOD of Aprepitant DRUG Peak Area 2799 3137 3288 3074.7 250.39 8.14 185
B. Suresh Babu et al ______________________________________________________________________________ J. Chem. Pharm. Res., 2013, 5(8): 181-187 LOQ SR NO DRUG Retention Time 4.30 4.29 4.29 4.3 0.01 0.13 Peak Area 4241 4641 4720 4534.0 256.80 5.66 1 2 3 MEAN ST DEV % CV Table 7: LOQ of Aprepitant System precision and System suitability: System precision and system suitability studies were carried out by injecting six replicates of the working standard solutions. The % RSD for the peak areas obtained was calculated. The data presented in table (% RSD < 1) establishes reproducible performance of the instrument. The system suitability parameters are given in Table 8. APREPITANT Sr. No Retention Time Peak Area 1 4.43 1077806 2 4.43 1085755 3 4.42 1088140 4 4.42 1074520 5 4.42 1086645 6 4.42 1080545 MEAN 4.423 1082235.2 SD 0.0052 5453.46 % RSD 0.12 0.50 Table 8: System Suitability test for Aprepitant Stress Degradation The stress studies involving acid, light (UV) and oxidation revealed that Aprepitant was not fully degraded (Figure 4). However in alkaline conditions (0.1N NaOH), the drug was instable and the degradation peak eluted earlier accompanied with a drastic peak distortion and increased tailing. Except for alkaline conditions, the drug content was within 95 –105 % for all stress conditions indicating the stability and specificity of the analytical method to differentiate the degradation peaks. Theoretical Plates 9443 9462 9316 9554 9509 9421 9450.8 81.59 0.86 Tailing Factor 1.29 1.30 1.31 1.29 1.29 1.30 1.3 0.01 0.63 Figure 4: Overlay Chromatogram showing the influence of various stress conditions on Aprepitant; Data 1 – Freshly prepared Sample; Data 2 – Oxidative Stress; Data 3 – Photolytic Stress; Data 4 – Acid Stress; Data 5 – Alkaline Stress. Data 5 clearly indicates the spectral degradation of Aprepitant due to alkaline instability Estimation of the drug from dosage forms: The assay of tablets containing Aprepitant is done using the procedure given in Indian Pharmacopoeia for tablets. Briefly, the active ingredient in each of ten dosage units taken at random is determined each individual dosage unit selected at random is initially powdered and transferred carefully into a 20 ml volumetric flask. To this 10 ml of methanol was initially added and vortexed thoroughly. The final volume is made up to volume with methanol. The final solution was mixed well. This mixture is then carefully filtered using 0.45µm membrane filter. The filtrate is 186
B. Suresh Babu et al ______________________________________________________________________________ J. Chem. Pharm. Res., 2013, 5(8): 181-187 then taken and suitably diluted and injected for analysis. The assay content was evaluated using the regression equation of linear calibration curve. The assay of tablets was found to be 100.03 ± 0.09 %. RESULTS AND CONCLUSION The method gave accurate and precise results in the concentration range of 2.53 to 50.57µg/ml. The mobile phase composition consists of (80:20 v/v) of Methanol and 10 Mm Sodium acetate (pH adjusted to 3.0 with glacial acetic acid), at the flow rate of 1.0 ml/min. The retention times of the drug are 4.40 minutes. The column is Agilent Polaris ODS 2 150 X 4.6mm, C18 column with the particle size of 5µm. A rapid sensitive and specific method for the determination of Aprepitant in the pharmaceutical formulations has been developed. The proposed RP-HPLC method for the estimation of Aprepitant in dosage form is accurate, precise, linear, rugged, robust, simple and rapid. Hence the present RP-HPLC method is suitable for the quality control of the raw materials, formulations and dissolution studies. Acknowledgement Authors are thankful to the Management and Principal of Shri Vishnu college of Pharmacy for providing necessary facilities REFERENCES [1] LA Sorbera; J Castaner; M Bayes; J Silvestre. Drugs Fut., 2002, 27(3), 211. [2] B Mats; JH Richard; BH Donald; RG Michae; S David; AR Scott. Bio Psych., 2004, 55(10), 1007-12. [3] ML Constanzer; CM Chavez-Eng; J Dru; WF Kline; BK Matuszewski. J Chromatogr B Analyt Technol Bio Med Life Sci., 2004, 807(2), 243-50. [4] CM Chavez-Eng; ML Constanzer; BK Matuszewski. J Pharm Biomed Anal., 2004, 35, 1213-29. [5] Di Wu; JP Dustin; Z Xianguo; D Steven; SB Jeffrey. J Pharm Biomed Anal., 2009, 49(3), 739-45. [6] JS Peter; A Ahmed; Yan Wu. J Pharm Biomed Anal.,2006, 41(3), 883-90. [7] L Lee Dupuis; W Karen Lingertat; EW Scott. Sup Car Can., 2009, 17, 701–6. [8] V Kiran Kumar; N Appala Raju; SH Begum; JVLN Seshagiri Rao; T Satyanarayana. J Pharm Tech., 2009, 2(2), 412-14. [9] Sreekanth Nama et al. Rec Res Sci Tech., 2011, 3, 16-24. [10] H Roy; X George; W Yadan; C Louis; W Tao; M Robert; V Anant. Anal. Chem., 2003, 75(3), 605–61. [11] International Conference on Harmonization (ICH), Validation of Analytical Procedures: Text and Methodology Q2 (R1), November 2005. [12] Umesh M.Patel, R.Nageshwara Rao. J. Chem. Pharm. Res., 2011, 3(6):200-211. [13] Sonia T.Hassib, Asmaa A.El-Zsher, Marwa A.Fouad. J. Chem. Pharm. Res., 2011, 3(6):243-258. [14] G.Anantha Ram, M.N.K.Harish, Y.Arthob Naik, J.Keshavayya, K.R.Venugopala Reddy. J. Chem. Pharm. Res., 2011, 3(6):945-949. [15] Bahia Abbas Moussa, Ramzia Ismail El-Bagary, Yasmin Abdullah Al-Eryani J. Chem. Pharm. Res., 2011, 3(5):425-437. 187