Download
1 / 13
130 likes | 160 Vues
A stability indicating RP-HPLC method was developed and validated as per international chemical harmonization guidelines, and adopted for the assay of Ibrutinib in bulk and tablet dosage forms. The chromatographic separation was carried out by using Waters (Alliance) HPLC 2695 series system equipped with UV-Visible spectrophotometer as detector. Mobile phase composed of 0.1% Orthophosphoric acid buffer and acetonitrile in the ratio 70:30 %v/v was allowed to flow through Inertsil ODS 100mm x 4.6 mm, 5uf06dm column at a flow rate of 0.8ml/minute, maintaining the column temperature at 30u00b0C. About 20u00b5l of standard or sample solution was injected into the column and the components were detected at a wavelength of 320nm. System precision and method precision of the proposed method was evaluated as %RSD and found to be 1.7252 and 1.0583 respectively. Accuracy of the developed method as percent of mean recovery at three different concentrations 50, 100 and 150% with respect to target concentration was determined and found to be 100.68, 100.90 and 100.33 respectively. The peak area was found to be proportional to concentration of Ibrutinib within the linearity limits 3.5-21.0u00b5g/ml, slope, intercept and correlation coefficient were determined by linear regression analysis. The developed method was found to be robust and rugged and was applied for quality control analysis of pharmaceutical formulations. The stability of the drug under different degradation conditions was examined and found to be stable. The proposed method was found to be simple and suggested for an alternative method in quality control in any quality control laboratories.

E N D
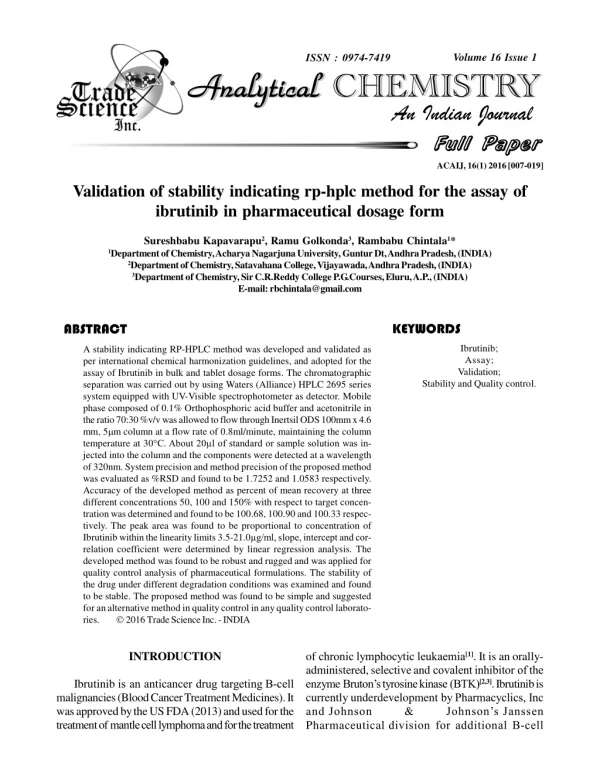
id3581171 pdfMachine by Broadgun Software - a great PDF writer! - a great PDF creator! - http://www.pdfmachine.com http://www.broadgun.com Volume 16 Issue 1 ISSN : 0974-7419 Analytical Analytical CHEMISTRY Analytical Analytical CHEMISTRY An Indian Journal Full Paper Full Paper ACAIJ, 16(1) 2016 [007-019] Validation of stability indicating rp-hplc method for the assay of ibrutinib in pharmaceutical dosage form Sureshbabu Kapavarapu2, Ramu Golkonda3, Rambabu Chintala1* 1Department of Chemistry, Acharya Nagarjuna University, Guntur Dt, Andhra Pradesh, (INDIA) 2Department of Chemistry, Satavahana College, Vijayawada, Andhra Pradesh, (INDIA) 3Department of Chemistry, Sir C.R.Reddy College P.G.Courses, Eluru, A.P., (INDIA) E-mail: rbchintala@gmail.com KEYWORDS ABSTRACT Ibrutinib; Assay; Validation; A stability indicating RP-HPLC method was developed and validated as per international chemical harmonization guidelines, and adopted for the assay of Ibrutinib in bulk and tablet dosage forms. The chromatographic separation was carried out by using Waters (Alliance) HPLC 2695 series system equipped with UV-Visible spectrophotometer as detector. Mobile phase composed of 0.1% Orthophosphoric acid buffer and acetonitrile in the ratio 70:30 %v/v was allowed to flow through Inertsil ODS 100mm x 4.6 mm, 5m column at a flow rate of 0.8ml/minute, maintaining the column temperature at 30°C. About 20µl of standard or sample solution was in- jected into the column and the components were detected at a wavelength of 320nm. System precision and method precision of the proposed method was evaluated as %RSD and found to be 1.7252 and 1.0583 respectively. Accuracy of the developed method as percent of mean recovery at three different concentrations 50, 100 and 150% with respect to target concen- tration was determined and found to be 100.68, 100.90 and 100.33 respec- tively. The peak area was found to be proportional to concentration of Ibrutinib within the linearity limits 3.5-21.0µg/ml, slope, intercept and cor- relation coefficient were determined by linear regression analysis. The developed method was found to be robust and rugged and was applied for quality control analysis of pharmaceutical formulations. The stability of the drug under different degradation conditions was examined and found to be stable. The proposed method was found to be simple and suggested for an alternative method in quality control in any quality control laborato- ries. 2016 Trade Science Inc. - INDIA Stability and Quality control. INTRODUCTION of chronic lymphocytic leukaemia[1]. It is an orally- administered, selective and covalent inhibitor of the enzyme Bruton’s tyrosine kinase (BTK)[2,3]. Ibrutinib is currently underdevelopment by Pharmacyclics, Inc and Johnson & Pharmaceutical division for additional B-cell Ibrutinib is an anticancer drug targeting B-cell malignancies (Blood Cancer Treatment Medicines). It was approved by the US FDA (2013) and used for the treatment of mantle cell lymphoma and for the treatment Johnson’s Janssen
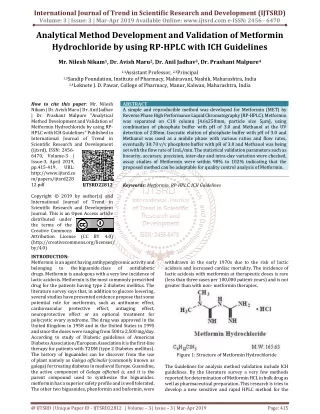
Validation of stability indicating rp-hplc method for the assay of ibrutinib . 8 ACAIJ, 16(1) 2016 Full Paper Full Paper malignancies including diffuse large B-cell lymphoma and multiple myeloma. The systematic (IUPAC) name of Ibrutinib is given by 1-[(3R)-3-[4- Amino-3-(4-phenoxyphenyl)-1H-pyrazolo [3, 4-d] pyrimidin-1-yl] piperidin-1-yl] prop-2-en-1-one. The molecular formula and molecular weight are C25H24N6O2 and 440.497 grams per mole respectively. It is soluble in polar solvents like water methanol and acetonitrile. It is available as Imbruvica capsules for oral administration containing 140 mg ibrutinib as the active ingredient. Each capsule also contains the inactive ingredients such as croscarmellose sodium, magnesium stearate, microcrystalline cellulose, sodium lauryl sulfate. The capsule shell contains gelatin, titanium dioxide and black ink. The molecular structure of Ibrutinib was given in Figure 1. Spectrum Labs, Hyderabad, Telangana state and formulations (Imbruvica 140mg capsules) were procured from the local market. HPLC grade acetonitrile and analytical grade chemicals such as ammonium phosphate, orthophosphoric acid, hydrochloric acid, sodium hydroxide and hydrogen peroxide used were procured from Merck Co, Mumbai, India. Instrumentation A waters (Alliance) HPLC 2695 series system consisting of 4 pump auto sampler with 5 racks with temperature control; auto injector has capacity to inject 5µl to 500µl, UV-Vis detector with PDA. The data were acquired via Empower-2 data acquisition software. Preparation of solutions Mobile phase About 1.0ml of orthophosphoric acid (OPA) was accurately measured and transferred into a 1000ml of volumetric flask, added about 900ml of milli-Q water and degassed to sonicate and finally made up the volume with water. 0.1% Orthophosphoric acid buffer and acetonitrile were mixed together in the ratio 70:30 %v/ v by adding 300ml of acetonitrile solvent to 700mL of 0.1%OPA buffer solution, sonicated for five minutes and used as mobile phase. Preparation of Ibrutinib standard An amount of 140mg of 99.8% pure API product Ibrutinib was accurately weighed and transferred into a 100ml clean dry volumetric flask, added 20ml of diluents (methanol), sonicated for 30 minutes and made up to the final volume with diluents. Then 1.0ml of above stock solution was transferred into a 10ml volumetric flask and then made up to the final volume with diluent. Sample preparation Average weight of five capsules were determined, and one capsule equivalent to 140mg of Ibrutinib was transferred into a 100ml clean dry volumetric flask, added 20ml of diluents (methanol), sonicated for 30 minutes and made up to the final volume with diluents. Then the solution was filtered and about 1.0ml of above stock solution was transferred into a 10ml volumetric flask and then made up to the final volume with diluent. Method developement Analytical method development, optimization and Figure 1 : The structure of Ibrutinib An extensive literature survey was carried out and found three LC-MS/MS methods for the simultaneous determination of Ibrutinib in combination with lenalidomide[4,5] and methocarbamol[6] in rat plasma. But no other methods were found for the determination of Ibrutinib and its formulations. As there is no HPLC method in the literature, the author made some investigations to develop a novel RP-HPLC method for the assay of Ibrutinib in pure and formulations. The main objectives of the present investigation are, the developed method should be a sensitive, selective, precise, accurate, simple, rapid and economic. The proposed method should be applicable to determine the quality of bulk product and to determine assay of formulations. MATERIALS AND METHODS Reagents and chemicals Ibrutinib reference compound was obtained from Analytical Analytical CHEMISTRY Analytical Analytical CHEMISTRY An Indian Journal
ACAIJ, 16(1) 2016 Rambabu Chintala et al. 9 Full Paper Full Paper validation are key elements of any pharmaceutical analysis. The objective of analytical HPLC method development is to identify, quantity or purifying compounds of interest. HPLC method development generally involves the selection of the HPLC method and initial system, selection of initial conditions, selectivity optimization, system optimization and method validation. When developing an HPLC method, the first step is always to consult the literature to ascertain whether the separation has been previously performed and if so, under what conditions - this will save time doing unnecessary experimental work. The key points kept in mind while developing HPLC method was to keep the method as simple as possible, choosing the most common columns and stationary phases, using binary mobile phases before going to ternary and finally thinking about the factors that are likely to be significant in achieving the desired resolution. HPLC method development is influenced by the nature of the analytes, depending on the overall requirements and nature of the sample and analytes. The selection of stationary phase, mobile phase, buffer, organic solvent and mobile phase composition during method development are based on the molecular weight, molecular structure, functional group, pKa value, UV spectrum and solubility of the Ibrutinib. Since the Ibrutinib was a non-ionic compound soluble in polar solvents, and having molecular weight 440.497g/mole, a reversed phase high performance liquid chromatography (RP_HPLC) method was chosen for the present investigation. In this method, the analyte is distributed between bonded stationary phase and polar mobile phase during the separation. Optimization Optimization of the proposed method was carried out by changing one of the chromatographic conditions such as column, composition of mobile phase, injection volume, flow rates, column temperature and detection wavelength keeping all other constant. Chromatograms were recorded for each variation; system suitable parameters such as number of theoretical plates, tailing factor and resolution, and chromatographic parameters such as retention time, peak area and peak height were obtained. Optimized chromatographic conditions Finally about 20 µl of working standard solution was injected into Inertsil ODS 100mm x 4.6 mm, 5m HPLC column maintained at a temperature of 30°C, the components were separated by using mobile phase of 0.1% orthophosphoric acid buffer and acetonitrile in the ratio 70:30 %v/v at a flow rate of 0.8ml/min (Isocratic mode). About 20 µl of standard or sample solution was injected into the column and the components were detected at a wave length of 320nm using a UV-Visible detector. Figure 2 : A typical chromatogram of blank solution for Ibrutinib Analytical Analytical CHEMISTRY Analytical Analytical CHEMISTRY An Indian Journal
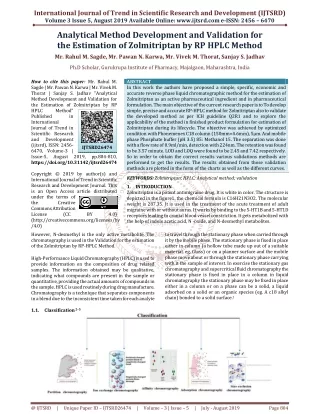
Validation of stability indicating rp-hplc method for the assay of ibrutinib . 10 ACAIJ, 16(1) 2016 Full Paper Full Paper Method Validation Method Validation, a one-time process performed after the method development to demonstrate whether the method is scientifically sound and that serves the intended analytical purpose or not. The most widely applied validation characteristics are accuracy, precision (repeatability and intermediate precision), specificity, detection limit, quantitation limit, linearity, range, robustness and stability of analytical solutions. Analytical methods used in quality control should ensure an acceptable degree of confidence that results of the analysis of raw materials, excipients, intermediates, bulk products or finished products, are viable. Specificity Specificity is defined as the ability of the method to accurately measure the analyte response in the presence of all potential sample components such as placebo formulation, synthesis intermediates, excipients, degradation products and process impurities. Other potential sample components are generated by exposing the analyte to stress conditions sufficient to degrade it to 80–90% purity. To demonstrate specificity, the response of the analyte in test mixtures containing the analyte and all potential sample components is compared with the response of a solution containing only the analyte. In the present investigation about 20µl of blank (analyte free solution), working standard (analyte) and sample solutions (placebo formulation) were injected separately into the column and chromatograms were recorded under the optimized chromatographic conditions and were presented in Figure 2, Figure 3 and Figure 4 respectively. Precision Precision (repeatability of the measurements or test results) of a test method is expressed as percent of standard deviation (%RSD) of a number of replicate measurements. To find the system precision, about 20 µl of working standard solution was injected into the HPLC system six times; chromatograms were recorded and peak area of each chromatogram was evaluated from the software. In the determination of method precision, six standard solutions of same batch product were prepared, and about 20 µl of each solution was injected into the HPLC system, chromatograms were obtained under the optimized conditions and peak area of each chromatogram was determined. Linearity and range The linearity of a test procedure is its ability to produce results within a given range that are directly proportional to the concentration of analyte in the sample. The range is the interval between the upper and lower levels of the analyte that have been determined with precision, accuracy and linearity using the method as written. In the present investigation, linearity was established by preparing a series of six standard solutions over the range of concentration 3.5-21.0 µg/ml and Figure 3 : A typical chromatogram of working standard solution for Ibrutinib Analytical Analytical CHEMISTRY Analytical Analytical CHEMISTRY An Indian Journal
ACAIJ, 16(1) 2016 Rambabu Chintala et al. 11 Full Paper Full Paper Figure 4 : A typical chromatogram of placebo solution for Ibrutinib chromatograms were obtained under the optimized conditions by injecting each of the solution twice into the system and thus chromatographic parameters were evaluated. A calibration plot was constructed by plotting mean peak area against concentration of Ibrutinib and was represented by Figure 5. Limit of detection and limit of quantitation The limit of detection (LOD) and limit of quantitation (LOQ) are determined by analysis of samples with known concentrations of analyte and by establishing the minimum level at which the analyte can be reliably detected or quantified with acceptable accuracy and precision respectively. In the present investigation signal- to-noise ratio is determined by comparing measured signals from samples with known low concentrations of analyte with those of blank samples and establishing minimum concentration at which the analyte can be reliably detected. A signal-to-noise ratio of 3:1 is considered acceptable for estimating LOD (with Relative Standard Deviation (RSD) d” 10%) whereas Figure 5 : A calibration plot of mean peak area against concentration of Ibrutinib Analytical Analytical CHEMISTRY Analytical Analytical CHEMISTRY An Indian Journal
Validation of stability indicating rp-hplc method for the assay of ibrutinib . 12 ACAIJ, 16(1) 2016 Full Paper Full Paper for LOQ signal-to-noise ratio of 10:1 is considered appropriate (with Relative Standard Deviation (RSD) d” 3%). In the present investigation, a series of low concentration solutions were prepared, retention time, the instrument response (peak area) was recorded as a function of time and signal-to-noise ratio was determined. Typical LOD and LOQ chromatograms were given in Figure 6 and Figure 7 respectively. Accuracy The term accuracy is usually applied to quantitative methods. It is usually determined by measuring a known amount of standard material under a variety of conditions but preferably in the formulation, bulk material or intermediate product to ensure that other components do not interfere with the analytical method. In the present investigation, spiked samples were prepared in triplicate at three levels across a range of 50-150% of the target concentration. Then the percent recovery was calculated. The accuracy criterion for an assay method is that the mean recovery will be 100±2% at each concentration across the range of 80-120% of the target concentration. Figure 6 : A typical chromatogram of LOD solution for Ibrutinib Figure 7 : A typical chromatogram of LOQ solution for Ibrutinib Analytical Analytical CHEMISTRY Analytical Analytical CHEMISTRY An Indian Journal
ACAIJ, 16(1) 2016 Rambabu Chintala et al. 13 Full Paper Full Paper Robustness The robustness, a measure of its capacity to remain unchanged by small but deliberate variations in method parameters like polarity of the solvent, pH of the buffer solution, temperature and wavelength. The robustness of test method is demonstrated by carrying out intentional method variations like mobile phase flow changes and column oven temperature variations. The %RSD of areas and retention times from repeated injections were not more than 2%. Ruggedness Ruggedness of the proposed method (intermediate precision) was demonstrated by two analysts, using two HPLC systems and evaluated the relative per cent purity data across the two HPLC systems at three concentration levels (50%, 100%, 150%) that covered the assay method range (3.5-21.0µg/ml). The mean, standard deviation and RSD across the systems and analysts were calculated from the individual relative per cent purity mean values at 50%, 100% and 150% of the test concentration. The %RSD of ruggedness was less than 2% and hence the method was rugged. Stability studies Samples and standards should be tested their stability during a period of at least 24 hours and component quantitation should be determined by comparison with freshly prepared standards. For the assay method, the sample solutions, standard solutions and HPLC mobile phase should be stable for 24 hours under defined storage conditions. For bulk pharmaceuticals, stress conditions such as heat (50–60 ºC), light (600 FC of UV), acid (0.1 M HCl), base (0.1 M NaOH) and oxidant (3% H2O2) are typical. For formulated products, heat, light and humidity (70- 80% RH) are often used. The resulting mixtures are then analysed, and the analyte peak is evaluated for peak purity and resolution from the nearest eluting peak. Acceptable stability is2% change in standard or sample response, relative to freshly prepared standards. Preparation of Ibrutinib standard An amount of 14g of 99.6% pure API product Ibrutinib was accurately weighed and transferred into a 100ml clean dry volumetric flask, added 20ml of diluents (methanol), sonicated for 30 minutes and made up to the final volume with diluents. Then 1.0ml of above stock solution was transferred into a 10ml volumetric flask and then made up to the final volume with diluent. Acid/ Base Hydrolysis Transferred an amount of reference sample equivalent to 14 mg of Ibrutinib into 100 ml RB flask, added 50 ml of freshly prepared 0.1 N HCl (or 0.1N NaOH) and kept aside for 24 hours, then filtered the solution through 0.4 micron filter into a 100 ml volumetric flask and neutralized with 0.1 N NaOH (or 0.1N HCl) and made up to the mark with diluent. Then about 1.0 ml of filtrate was diluted to 10 ml with mobile phase. Oxidation In oxidative degradation, an amount of reference sample equivalent to 14 mg of Ibrutinib was accurately weighed and transferred into 100 ml RB flask, added 50 ml 3.0% hydrogen peroxide and kept aside for 24 hours, then filtered the solution through 0.4 micron filter into a 100 ml volumetric flask and made up to the mark with diluent, now 1.0 ml of filtrate was diluted to 10 ml with mobile phase and used for analysis. Heat / UV Exposure In the study of thermal degradation, an amount of the sample equivalent to 14 mg of Ibrutinib was accurately weighed and transferred into a clean and dry Petri dish, spread it throughout the plate, and placed it in a hot air oven at 100°C or UV chamber for 24 hours. After 12 hours, transferred the sample into 100 ml volumetric flask, added 50 ml of diluents, sonicated for 10 minutes and diluted with diluents, further filtered the solution, and then diluted 1.0 ml of filtrate to 10 ml with mobile phase. Water hydrolysis An amount of reference sample equivalent to 14 mg of Ibrutinib was transferred into 100 ml RB flask, added 50 ml of distilled water and kept aside for 24 hours, then filtered the solution through 0.4 micron filter into a 100 ml volumetric flask and made up to the mark with diluent. Then about 1.0 ml of filtrate was accurately transferred into 10 ml volumetric flask and made up to the mark with mobile phase. About 20 µl of each of the above solutions was injected into the column separately, the chromatograms were obtained under the optimized chromatographic conditions and the percent of degradation was calculated from the peak area of freshly prepared standard solution Analytical Analytical CHEMISTRY Analytical Analytical CHEMISTRY An Indian Journal
Validation of stability indicating rp-hplc method for the assay of ibrutinib . 14 ACAIJ, 16(1) 2016 Full Paper Full Paper Figure 8 : A typical chromatogram in the study of acidic degradation for Ibrutinib Figure 9 : A typical chromatogram in the study of basic degradation for Ibrutinib and degradation solution. The chromatograms in the study of acedic, basic, peroxide, thermal, photolytic and aqueous degradation were presented from Figure 8 to Figure 13 respectively. final volume and filtered through 0.4 micron membrane filter. Then, about 1.0 ml of the filtrate was transferred into 10 ml volumetric flask and diluted to volume with diluent. About 20µl of 14ìg/ml standard or sample was injected, chromatograms were obtained under the optimized conditions and percent of assay was calculated. ASSAY THEORY AND CALCULATIONS An amount of Ibrutinib working standard or capsule equivalent to 140 mg of Ibrutinib was transferredinto 100 ml volumetric flask, and about 50ml of diluent was added, sonicated for five minutes to dissolve, diluted to Chromatographic parameters The chromatographic parameters that are affected Analytical Analytical CHEMISTRY Analytical Analytical CHEMISTRY An Indian Journal
ACAIJ, 16(1) 2016 Rambabu Chintala et al. 15 Full Paper Full Paper Figure 13 : A typical chromatogram in the study of aqueous degradation for Ibrutinib Column efficiency/band broadening Efficiency (N) of a column is measured by the number of theoretical plates. It is a measure of band spreading of a peak. Similar the band spread, higher is the number of theoretical plates, indicating that good column and system performance. Column with N ranging from 5,000 to 1,00,000 plates/meter are ideal for a good system. Efficiency is calculated using the formula, N =16 Rt Where, Rt is the retention time and W is the peak width. Statistical parameters Standard deviation (SD) and % relative standard deviation (%RSD) Standard deviation is the square root of the sum of squares of deviations of individual results for the mean, divided by one less than the number of results in the set. Precision (refers to the reproducibility of measurement within a set, i.e., to the scatter of dispersion of a set about its central value) of n- replicate measurements is expressed in terms percent of relative standard deviation which is the standard deviation expressed as a fraction of the, mean, i.e. S/x. It is sometimes multiplied by 100 and expressed as a percent relative standard deviation. It becomes a more reliable expression of precision. The mean, standard deviation (SD) and percent of relative standard deviation (%RSD) are given by the following formulae. by the changes in chromatographic conditions are resolution, peak asymmetry or peak tailing factor and column efficiency or band broadening. Resolution (Rs) Resolution is the parameter describing the separation power of the complete chromatographic system relative to the particular components of the mixture. The resolution (Rs) of two neighbouring peaks is defined as the ratio of the distance between two peak maxima. It is the difference between the retention times of two solutes divided by their average peak width. Rs = 2(t2– t1)/W1 + W2 t1 and t2 are retention times of the first and second adjacent bands ;W1 and W2 are base line band widths. There are three fundamental parameters that influence the resolution of a chromatographic separation capacity factor, selectivity and column efficiency Peak asymmetry/peak tailing Peak with poor symmetry can result in (i)inaccurate plate number and resolution measurement (ii) imprecise quantization (iii) degraded resolution and undetected minor bands in the peak tail (iv) poor retention reproducibility. Peak asymmetry factor can be used as a criterion of column performance. The peak half width, b, of a peak at 10% of the peak height, divided by the corresponding front half width, a, gives the asymmetry factor. As =b / a. For a well-packed column, an asymmetry factor of 0.9 to 1.1 should be achievable. 2 / W2 Analytical Analytical CHEMISTRY Analytical Analytical CHEMISTRY An Indian Journal
Validation of stability indicating rp-hplc method for the assay of ibrutinib . 16 ACAIJ, 16(1) 2016 Full Paper Full Paper Mean = SUM of X values/Number of X values SD = SQRT (SUM of (Xi-Mean)2)/(Number of values -1)) %RSD = (SD/Mean)*100 Linear regression analysis In the instrumental methods of analysis, the concentration of a sample cannot be measured directly, but it can be determined by measuring a physical property which is proportional to concentration of the analyte. The calibration between y = g (x) is directly useful and yields by inversion of the analytical calculation function. The calibration function can be obtained by fitting an adequate mathematical model through the experimental data. The most convenient calibration function is linear, goes through the origin and is applicable over a wide dynamic range. For the majority of analytical techniques the analyst uses the calibration equation. Y = a + bx. Least-squares regression analysis can be used to describe the relationship between response (y) and concentration (x). One must now find the estimates of intercept (a) and slope (b). b = (n*SUM of XiYi-SUM Xi*SUM Yi)/(n*SUM Xi a = (SUM Yi *SUM Xi (SUM Xi)2) Correlation coefficient (r) Pearson’s correlation coefficient (r) is used to establish whether there is a linear relationship between two variables xi and yi. The value of r must lie between +1 and -1; the nearer it to ±1, values close to +1 indicate positive correlation and values close to -1 indicate negative correlation. Values of r that towards zero indicate that x and y are not linearly related. R = (SUM of ((Xi-Mean of X)*(Yi-Mean of Y))/(n-1))/(SUM of (Xi-Mean of X)2* (Yi-Mean of Y)2)/(n-1)2)) TABLE 1 : System suitable parameters of the developed method for Ibrutinib USP Tailing factor -- 1.26 1.30 Retention time Peak area USP Plate count S.No. Blank Standard Sample -- -- -- 2.520 2.518 2343436 2344059 5117 5176 Specificity In the study of specificity, the number of peaks and area of each peak of blank or test was compared with standard and found no additional peaks. Retention time and peak area of standard or sample were found to be 2.520 min (2.518min) and 2343436 (2344059) respectively. The chromatograms of blank and sample were compared with standard chromatogram and found no additional peaks except Ibrutinib in sample. Precision In the study of precision, system precision and the method precision were investigated by performing six determinations of the same batch of product. Mean standard deviation and % RSD values were evaluated by using Microsoft Excel Sheet. The results show that the system and method precision obtained by one operator in one laboratory were found to be 1.7252 and 1.0583 % RSD for Ibrutinib peak area respectively. The results of system precision and method precision were presented in TABLE 2. 2-(SUM Xi)*2) 2- SUM Xi *SUM of XiYi)/(n*SUM Xi 2- TABLE 2 : Results of system precision and method precision for Ibrutinib S.No. 1 2 3 4 5 6 Mean SD % RSD System precision Peak area 2343736 2407223 2385524 2461589 2393948 2359365 2391898 41266.20 1.7252 Method precision Peak area 2360289 2398704 2402164 2424166 2366953 2412533 2394135 25338.1 1.0583 RESULTS System suitable parameters Chromatograms for standard and sample were recorded and chromatographic parameters such as retention time, number of theoretical plates, tailing factor, area of the peak and peak height were obtained and found to be within the acceptable limits. The system suitable parameters and chromatographic parameters were presented in TABLE 1. SD : Standard deviation, %RSD: Percent relative standard deviation Analytical Analytical CHEMISTRY Analytical Analytical CHEMISTRY An Indian Journal
ACAIJ, 16(1) 2016 Rambabu Chintala et al. 17 Full Paper Full Paper Linearity In the present study, linearity was studied in the concentration range of 3.5-21.0 µg/ml (50–150% of the theoretical concentration in the test preparation,n=3) and the following regression equation was found by plotting the peak area (y) versus the Ibrutinib concentration (x) expressed in µg/ml, y=17618x+435.2 (r2)=0.9997. The demonstration coefficient (r2) obtained for the regression line demonstrates the excellent relationship between peak area and concentration of Ibrutinib. The experimental results of linearity studies were presented in TABLE 3. levels (50%, 100% and 150%) with respect to precision concentration, and mean percent of recovery was determined at each concentration from the area and the results were given in TABLE 5. TABLE 5 : Results of accuracy studies for Ibrutinib Amount of Taken µg/ml Amount Recovered µg/ml Amount Added µg/ml Percent recovery Concentration level 50% 1 7.0 14.0 6.966 99.52 2 7.0 14.0 7.116 101.66 3 7.0 14.0 7.059 100.85 100% TABLE 3 : Results of Linearity studies of the proposed method for Ibrutinib 1 14.0 14.0 14.249 101.78 2 14.0 14.0 13.986 99.90 3 14.0 14.0 14.141 101.01 S.No. 1 2 3 4 5 6 Concentration of Ibrutinib 3.50 7.00 10.50 14.00 17.50 21.00 Slope Intercept Correlation coefficient Peak area* 599387 1208609 1911138 2488155 3049768 3695021 176177.3 435.79 0.9997 150% 1 21.0 14.0 20.910 99.58 2 21.0 14.0 21.090 100.43 3 21.0 14.0 21.204 100.97 Ruggedness The study of ruggedness was demonstrated by the experiments carried out with different instruments, different columns and on different days. The mean, SD and %RSD of ruggedness results were presented in TABLE 6. Robustness The study of robustness carried out intentional variations in chromatographic parameters such as flow rate and mobile phase composition and the results of robustness studies were reported in TABLE 7. The method was robust for change in flow rate buffer variation and column temperature. *Average of three determinations LOD and LOQ In the present investigation, LOD and LOQ values of the proposed method for Ibrutinib were experimentally determined by recording chromatograms of LOD and LOQ working standard solutions and found to be 0.03 and 0.10 µg/ml respectively. The results were presented in TABLE 4. TABLE 6 : Results of ruggedness studies for Ibrutinib TABLE 4 : Results of LOD and LOQ values for Ibrutinib S.No. Day-1 Day-2 Instrument-1 Instrument-2 Retention time 2.500 Peak area -- Signal /Noise -- Peak area Peak area Peak area Peak area S.No. Concentration 1 2359872 2424586 2375864 2347952 Blank LOD standard LOQ standard Accuracy In the proposed, method accuracy was evaluated by using standard addition method at three concentration 0.00 2 2424584 2454697 2425493 2469741 0.03 ìg/ml 2.518 21725 2.51 3 2398432 2349853 2354865 2365894 4 2425846 2445876 2435974 2424946 0.10 ìg/ml 2.519 92448 9.91 5 2349531 2398532 2325974 2395495 6 2389426 2389543 2359486 2425842 Mean 2391282 2410515 2379609 2404978 SD 31899.83 39150.32 42872.59 44492.08 %RSD 1.3340 1.6241 1.8017 1.8500 Analytical Analytical CHEMISTRY Analytical Analytical CHEMISTRY An Indian Journal
Validation of stability indicating rp-hplc method for the assay of ibrutinib . 18 ACAIJ, 16(1) 2016 Full Paper Full Paper TABLE 7 : Results of study of robustness studies for Ibrutinib Retention time 2.520 2.517 2.524 2.521 2.517 Peak area 2343436 2415789 2384765 2358746 2453164 USP Plate count 5117 5214 5146 5151 5143 USP Tailing factor 1.26 1.28 1.23 1.24 1.21 S.No. Variation 1 Optimized conditions Less flow rate More flow rate Less organic composition More organic composition Sample Stability studies Stability of the developed method was studied under different stressed conditions like 0.1N HCl, 0.1N NaOH, 3%H2O2, thermal (60oC) and photolytic (600 FC of UV). The percent of degradation and thus stability of the Ibrutinib was determined from the area of the chromatographic peaks, and from the calculations it was found that the drug was stable and the percent of degradation was found to be in from 0.8 to 7.44%, and the results were presented in TABLE 8. DISCUSSION An isocratic RP-HPLC assay method was developed for the determination of Ibrutinib in bulk and pharmaceutical dosage forms. A Waters (Alliance) HPLC System (2695 series), Inertsil ODS 100mm x 4.6 mm, 5m HPLC column, UV-Visible detector, 320nm as detection wavelength, 0.1% orthophosphoric acid buffer and acetonitrile in the ratio 70:30 %v/v as TABLE 8 : Results of degradation studies for Ibrutinib Degradation parameter Standard Acid degradation Base degradation Peroxide degradation Thermal degradation UV degradation Water degradation Peak area 2391898 2222842 2278930 2287236 2293904 2336922 2382498 Percent found 100 92.56 94.89 95.24 95.51 97.31 99.20 Percent degradation 7.44 5.11 4.76 4.49 2.69 0.8 mobile phase, 0.8ml/min as flow rate and an injection volume 20µl were adopted in the proposed method. The developed method was optimized by changing one of the chromatographic conditions keeping other parameters constant. The developed method was validated as per the ICH guidelines and applied in the study of assay and stability determination. The proposed method was found to be simple, sensitive and rapid, and can be used in quality control of bulk drugs and formulations. Therefore the method can be used for routine analysis in quality control laboratories. ACKNOWLEDGEMENTS The authors are grateful to Spectrum Labs, Hyderabad, Telangana State, India for providing gifted samples of Ibrutinib. The authors are also grateful to the department of Chemistry, Acharya Nagarjuna University, Guntur District, Andhra Pradesh, India for providing all the laboratory facilities for doing this research work. CONCLUSIONS CONFLICT OF INTEREST A simple isocratic RP-HPLC method was developed for the determination of Ibrutinib in pharmaceutical formulations. The proposed method was found to be simple, precise, accurate, robust and rugged. The authors have no conflict of interest to publish our paper in your esteemed journal. Analytical Analytical CHEMISTRY Analytical Analytical CHEMISTRY An Indian Journal
ACAIJ, 16(1) 2016 Rambabu Chintala et al. 19 Full Paper Full Paper REFERENCES [5] Sridhar Veeraraghavan, Srikant Viswanadha, Satish Thappali, Babu Govindarajulu, Swaroopkumar Vakkalanka, Manivannan Simultaneous quantification of lenalidomide, ibrutinib and its active metabolite PCI-45227 in rat plasma by LC-MS/MS: application to a pharmacokinetic study, Journal of Pharmaceutical and Biomedical Analysis, (2014). [6] Sateesh Thappali, C.Wali Deepa, J.Bariwal, S.Kadams, S.R.Dhaneshwar; Simultaneous spectrophotometric estimation of ibuprofen and methocarbamol in tablet dosage form, Indian Journal of Pharmaceutical Sciences, 66, 810-813 (2004). Rangasamy; [1] Azvolinsky, Anna; FDA Approves Ibrutinib for Chronic Lymphocytic Leukemia, Cancer Network, (2014). [2] Z.Pan, H.Scheerens, S.J.Li, B.E.Schultz, P.A.Sprengeler, L.C.Burrill et al.; Discovery of selective irreversible inhibitors for Bruton’s tyrosine kinase; Chem.Med.Chem., 2(1), 58–61 (2007). [3] L.Honigberg, E.Verner, Z.Pan; Inhibitors of Bruton’s Tyrosine Kinase, (2009). [4] S.Veeraraghavan, S.Viswanadha, S.Thappali, B.Govindarajulu, S.Vakkalanka, M.Rangasamy; Simultaneous quantification of lenalidomide, ibrutinib and its active metabolite PCI-45227 in rat plasma by LC-MS/MS: Application to a pharmacokinetic study, J.Pharm.Biomed.Anal., 107, 151-158 (2015). Analytical Analytical CHEMISTRY Analytical Analytical CHEMISTRY An Indian Journal