Download
1 / 6
60 likes | 299 Vues
A RP-HPLC method was developed for simultaneous estimation of Paracetamol and Etoricoxib<br>tablet formulation using Phenomenex Luna C18 column (250 mm × 4.6 mm id, 5 µm particle<br>size) and a mobile phase of methanol : water (70:30 v/v), at flow rate 1.0 ml/min with UV<br>detection at 235 nm. The retention time (tR) of Paracetamol and Etoricoxib found to be 3.07 and<br>5.72 min respectively. The proposed method was validated for system suitability, specificity,<br>linearity, accuracy, precision, LOD, LOQ and robustness. All parameters were found to be<br>within the acceptance limit. Linearity over the concentration range 5-30 µg/ml for both<br>Paracetamol and Etoricoxib with regression coefficient (r2<br>) 0.9998 and 0.9994 respectively.<br>Limit of detection (LOD) found to be 0.10 µg/ml and 0.04 µg/ml whereas limit of quantitation<br>(LOQ) found to be 0.33 µg/ml and 0.13 µg/ml for Paracetamol and Etoricoxib respectively. The<br>accuracy of the proposed method was determined by recovery studies and found to be 99.74%-<br>101.25% and 99.08%-99.21% for Paracetamol and Etoricoxib respectively. <br>

E N D
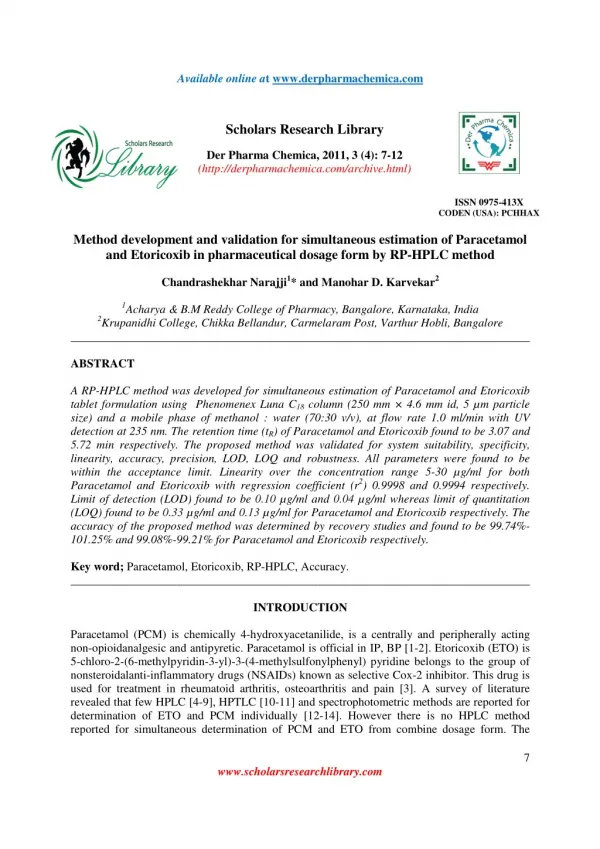
Available online at www.derpharmachemica.com Scholars Research Library Der Pharma Chemica, 2011, 3 (4): 7-12 (http://derpharmachemica.com/archive.html) ISSN 0975-413X CODEN (USA): PCHHAX Method development and validation for simultaneous estimation of Paracetamol and Etoricoxib in pharmaceutical dosage form by RP-HPLC method Chandrashekhar Narajji1* and Manohar D. Karvekar2 1Acharya & B.M Reddy College of Pharmacy, Bangalore, Karnataka, India 2Krupanidhi College, Chikka Bellandur, Carmelaram Post, Varthur Hobli, Bangalore ______________________________________________________________________________ ABSTRACT A RP-HPLC method was developed for simultaneous estimation of Paracetamol and Etoricoxib tablet formulation using Phenomenex Luna C18 column (250 mm × 4.6 mm id, 5 µm particle size) and a mobile phase of methanol : water (70:30 v/v), at flow rate 1.0 ml/min with UV detection at 235 nm. The retention time (tR) of Paracetamol and Etoricoxib found to be 3.07 and 5.72 min respectively. The proposed method was validated for system suitability, specificity, linearity, accuracy, precision, LOD, LOQ and robustness. All parameters were found to be within the acceptance limit. Linearity over the concentration range 5-30 µg/ml for both Paracetamol and Etoricoxib with regression coefficient (r2) 0.9998 and 0.9994 respectively. Limit of detection (LOD) found to be 0.10 µg/ml and 0.04 µg/ml whereas limit of quantitation (LOQ) found to be 0.33 µg/ml and 0.13 µg/ml for Paracetamol and Etoricoxib respectively. The accuracy of the proposed method was determined by recovery studies and found to be 99.74%- 101.25% and 99.08%-99.21% for Paracetamol and Etoricoxib respectively. Key word; Paracetamol, Etoricoxib, RP-HPLC, Accuracy. ______________________________________________________________________________ INTRODUCTION Paracetamol (PCM) is chemically 4-hydroxyacetanilide, is a centrally and peripherally acting non-opioidanalgesic and antipyretic. Paracetamol is official in IP, BP [1-2]. Etoricoxib (ETO) is 5-chloro-2-(6-methylpyridin-3-yl)-3-(4-methylsulfonylphenyl) pyridine belongs to the group of nonsteroidalanti-inflammatory drugs (NSAIDs) known as selective Cox-2 inhibitor. This drug is used for treatment in rheumatoid arthritis, osteoarthritis and pain [3]. A survey of literature revealed that few HPLC [4-9], HPTLC [10-11] and spectrophotometric methods are reported for determination of ETO and PCM individually [12-14]. However there is no HPLC method reported for simultaneous determination of PCM and ETO from combine dosage form. The 7 www.scholarsresearchlibrary.com
Chandrashekhar Narajjiet al _____________________________________________________________________________ Der Pharma Chemica, 2011: 3 (4):7-12 present work describes the simple, precise and accurate RP-HPLC method for simultaneous estimation of PCM and ETO in tablets. MATERIALS AND METHODS Materials Pure PCM was provided as gift sample by Micro Lab Pvt. Ltd. Bangalore and pure ETO was provided as gift sample by Zydus cadila pharmaceuticals Ltd, Ahmedabad. Combined dosage form Nucoxia-P (500 mg of PCM and 60 mg of ETO), was procured from local market. All chemicals and reagents used were of HPLC grade. Instrumentation High performance liquid chromatography LC 20AT SHIMADZU reciprocating dual pump, SPD 20A detector, A reversed-phase Phenomenex-Luna C18 250 x 4.6 mm, 5 µm column use for separation. Chromatographic data was acquired using LC solution software. Rheodyne injector used. Chromatographic conditions A reversed-phase Phenomenex-Luna C18 250 x 4.6 mm, 5 µm column was used as stationary phase. Methanol: water in the ratio of 70:30 % v/v was used as mobile phase and was filtered before use through 0.45 µ membrane filter. A constant flow of 1.0 ml/min was maintained throughout the analysis. Detection was carried out using UV detector at 235 nm. To ascertain the suitability of the proposed chromatographic conditions, system suitability tests were carried out and the results are shown in Table 1. Table 1. System suitability parameters Drug Name Theoretical plate/meter Symmetry Resolution Retention time(tR in min) Preparation of standard calibration curves (Linearity) Accurately 50 mg of PCM and ETO were weighed and transfer into a clean and dry 50 ml volumetric flask, dissolved with sufficient volume of mobile phase and made up to 50 ml with mobile phase. Further, 1 ml of the stock solution was diluted in 10 ml volumetric flask with mobile phase to get a concentration 100 µg/ml. Aliquots of standard stock solution were appropriately diluted with mobile phase to obtain concentration range of 5-30 µg/ml for both drugs. The diluted standard solutions with varying concentration were injected (in triplicate) into the HPLC system separately and chromatographed under above mentioned chromatographic conditions. Chromatographic peaks were recorded at 235 nm using UV detector. Analysis of tablet formulation For the estimation of drugs in the commercial formulations, twenty tablets were weighed and average weight was calculated. The powder equivalent to 50 mg of PCM equivalent to 63.6 mg of tablet powder transferred to 50 ml volumetric flask; 50 ml portion of mobile phase was added PCM 200042.219 30293.306 0.960 10.51 3.07 ETO 0.967 5.72 8 www.scholarsresearchlibrary.com
Chandrashekhar Narajjiet al _____________________________________________________________________________ Der Pharma Chemica, 2011: 3 (4):7-12 and sonicated for 20 min. and then volume was made up to the mark with mobile phase. The resulting solution was mixed and filtered through Whatmann filter paper and filtrate was appropriately diluted. From this, 1 ml of the solution pipette out into 10 ml volumetric flask and adjust the volume up to 10 ml with mobile phase to get concentration of 100 µg/ml. Again from this 2 ml of the solution was pipette out into 10 ml volumetric flask and adjust the volume up to 10 ml with mobile phase to get a concentration 20 µg/ml. The diluted solutions were filtered through 0.20 µ filter. From the filtrate, 20 µl was injected into the column and chromatographed under above mentioned chromatographic conditions. Each sample solution was injected and chromatographed in triplicate. Six such samples were prepared and analyzed. Content of ETO in tablet was calculated by comparing mean peak area of sample with that of the standard. Results of analysis of tablets formulation are shown in Table .2 and chromatogram are shown in figure 1 Table 2. Results of analysis of tablet formulation Drug Name Peak area* SD % RSD of peak area Concentration (µg/ml) Amount of drug found in mg Assay* (%) *average of six value, SD-Standard deviation, RSD-Relative standard deviation Figure 1.Chromatogram for assay of PCM and ETO in tablet dosage form PCM 2421298 20975.7 0.86 19.971 499.23 99.84 ETO 279078 728.338 0.26 2.377 59.24 98.73 Method Validation Accuracy To ascertain the accuracy of the proposed method recovery studies were carried out by standard addition method, adding known amount of each drug to the preanalysed tablet powder. Recovery studies were carried out in triplicate at each level. The results of recovery studies were expressed as percent recovery and are shown in Table 3. 9 www.scholarsresearchlibrary.com
Chandrashekhar Narajjiet al _____________________________________________________________________________ Der Pharma Chemica, 2011: 3 (4):7-12 Table No: 3: Results for recovery studies Amt. taken (mg) 10 10 10 1.2 1.2 1.2 Amt. of standard drug added (µg) Total % RSD * Found concentration % Drug concentration (µg) 18 20 22 9.2 11.2 13.2 (µg) Recovery* 99.75 99.74 101.25 99.21 99.23 99.08 8 10 12 8 10 12 0.34 0.16 0.86 0.40 0.59 0.67 17.98 19.97 22.15 9.13 11.12 13.09 PCM ETO *average of three value, RSD= Relative standard deviation Precision Intra-day precision was determined by analyzing the capsule samples at three different time intervals on the same day and for inter-day precision capsule samples were analyzed on three different days. Standard deviation for intra-day and inter-day assay precision was calculated. Results of precision studies are shown in Table No. 4-5 Table No: 4: Result of intraday precision studies Parameters Component Concentration (µg/ml) Peak area* Intra-day 20 ETO 15 20 Inter-day 20 ETO 15 20 *average of three value, SD= Standard deviation, RSD= Relative standard deviation Limit of detection (LOD) and Limit of quantitation (LOQ) LOD and LOQ for both the drugs were calculated by using the values of slopes and intercepts of the calibration curves. Robustness Robustness of the proposed method was ascertained by deliberately changing the chromatographic conditions such as change in flow rate of the mobile phase (± 0.1 mL/min), change in ratio of mobile phase. Effect of change in chromatographic parameters on resolution and tailing factor of peak was studied. RESULTS AND DISCUSSION The proposed chromatographic system was found suitable for effective separation and quantitation of PCM (tR-3.07 min) and ETO (tR -5.72 min) with good resolution, peak shapes and SD % RSD * 1.69 0.19 0.55 1.60 1.46 0.41 0.02 0.01 0.01 0.13 0.05 0.08 10 15 1249078 1836836 2424304 1198367 1816563 2408459 1248483 1835894 2424017 1197057 1814628 2401173 21185.09 3580.737 13533.49 19244.5 26545.7 10104.4 335.961 239.592 282.758 1572.178 919.924 2088.788 PCM 10 10 15 PCM 10 10 www.scholarsresearchlibrary.com
Chandrashekhar Narajjiet al _____________________________________________________________________________ Der Pharma Chemica, 2011: 3 (4):7-12 minimal tailing. The peak areas of the drugs were reproducible as indicated by low coefficient of variance indicating the repeatability of the proposed method. Both the drugs were found to give linear detector response in the concentration range under study with correlation coefficient of 0.9998 and 0.9994 for PCM and ETO, respectively. The sample recoveries from the formulation were in good agreement with their respective label claim indicating that there is no interference from the tablet excipients. The accuracy of proposed method was determined by recovery study and percentage recovery found to be 99.74-101.25 % for PCM and 99.08-99.23 % for ETO respectively. The limit of detection of proposed method was found to be 0.10µg/ml for PCM and 0.004 µg/ml for ETO respectively whereas the limit of quantitation was found to be 0.33 µg/ml for PCM and 0.130 µg/ml for ETO. The results of robustness study also indicated that the method is robust and is unaffected by small deliberate variations in the method parameters. CONCLUSION The proposed method was validated as per ICH guidelines. The standard deviation and % RSD calculated for the proposed method is low, indicating high degree of precision of the method. The results of the recovery studies performed show the high degree of accuracy of the proposed method. Hence, it can be concluded that the developed RP-HPLC method is accurate, precise and selective and can be employed successfully for the estimation of PCM and ETO in bulk and tablet dosage form Acknowledgement The authors wish to sincerely thank the chairman and principal of Acharya & B.M Reddy college of Pharmacy, Bangalore REFERENCE [1]Indian Pharmacopoeia, vol II, The Indian pharmacopoeia commission, Ghaziabad, 2010, 1418-1419. [2]British Pharmacopeia, vol II, Stationary Office Medicines and Health Care Products Regulatory Agencies, London, 2009, 6th edition, 1554. [3]Etoricoxib drug profile [Cited 2009 oct.11]. Available at URL “http://en.wikipedia.org/wiki/ Etoricoxib. [4]H.M. Patel, B.N. Suhagia, S.A. Shah, I.S. Rathod, Indian J Pharm. Sci., 2007, 69, 7, 703- 705. [5]U. Mandal, R.D. Senthil, A. Bose, K.V Gowda, A. Ghosh, T.K Pal, Indian J Pharm. Sci., 2006, 68, 4, 485-489. [6]G. Subramaniam, R. Shetty, S. Agarwal, S. Pandey, N. Udupa, Indian J Pharm. Sci., 2005, 67, 2, 247-249. [7]A.S. Bhavasar, G.S. Talele, R.A. Fursule, S.J. Surana, Indian J Pharm. Sci., 2006, 68, 5, 675- 677. [8]V.P. Godse, M.N. Deodhar, A.V. Bhosale, R.A. Sonawane, P.S. Sakpal, D.D. Borkar, Y.S. Bafana, Asian J Res Chem., 2009, 2, 1, 37-40. [9]G. Deepali, D. Pandurang, Int J Chem Anl Sci., 2010, 2, 2, 942-946. [10]S.R. Vivek, V.G. Santosh, P.P. Upasana, R.S. Mahima, J AOAC Int., 2010, 93, 3, 783-786. 11 www.scholarsresearchlibrary.com
Chandrashekhar Narajjiet al _____________________________________________________________________________ Der Pharma Chemica, 2011: 3 (4):7-12 [11]N.J. Shah, S.J. Shah, D.M. Patel, N.M. Patel, Indian J Pharm. Sci., 2006, 68, 6, 788-789. [12]S.R. Shahi, G.R. Agrawal, P.B. Rathi, N.B. Shinde, V.G. Somani, S.B. Mahamuni et al. Rasayan J Chem., 2008, 1, 2, 390-394. [13]N. Aditya, R.K. Arora, T. Meena, Indian J Pharm. Sci., 2006, 68, 3, 370-373. [14]N .Vaishali, Y.R. Dhurvey, D. Shilpa, U. Kanchan, Indian J Pharm. Sci., 2006, 68, 5, 639- 640. 12 www.scholarsresearchlibrary.com