Download
1 / 7
90 likes | 230 Vues
Water is one of the most abundantly available resources in nature. It is an essential constituent<br>to all living beings. It occupies nearly 75% of matter of earth’s crust. But due to industrialization<br>and urbanization natural water resources are lessening or declining to a great extent. A call for<br>conservation and probable option for water resources is on peak. Limited1<br> natural rainfallrecharge<br>and increased water usage throughout the country calls for conservation as well as<br>augmentation .Physico-chemical monitoring of ground water samples of various reservoirs in<br>Chandrapur town, was carried out. Water samples for above study were collected from 7<br>stations enlisting tube well, coal mine reservoir and rivers. Various parameters were analyzed<br>by using standard methods (APHA) and their comparison with WHO standard values, suggested<br>that most of the parameters were within permissible limit and by water treatment the<br>concentration of parameters beyond the limits in coalmine could be reduced and could be an<br>invaluable source for domestic purposes in the region. The present paper accounts water quality<br>of various sites situated in Chandrapur and their efficiencies respectively.

E N D
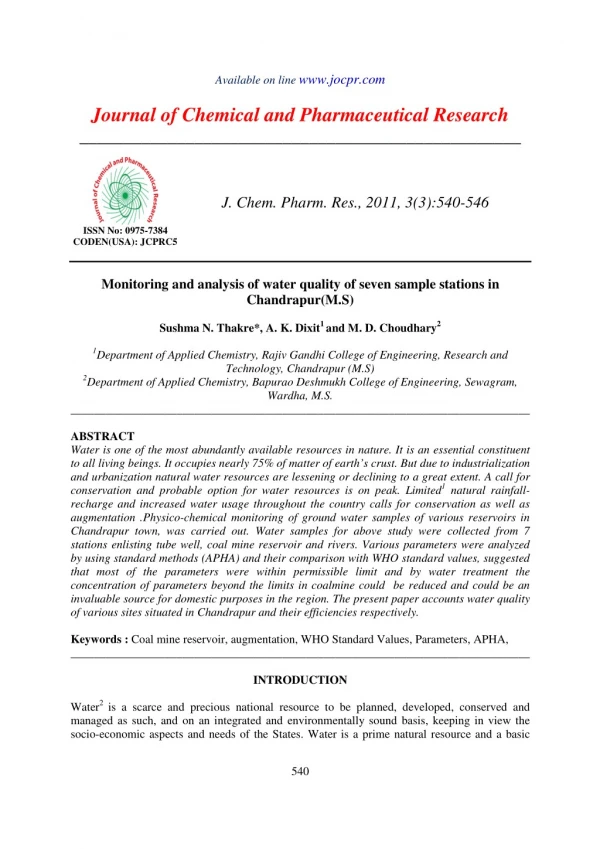
Available on line www.jocpr.com Journal of Chemical and Pharmaceutical Research __________________________________________________ J. Chem. Pharm. Res., 2011, 3(3):540-546 ISSN No: 0975-7384 CODEN(USA): JCPRC5 Monitoring and analysis of water quality of seven sample stations in Chandrapur(M.S) Sushma N. Thakre*, A. K. Dixit1 and M. D. Choudhary2 1Department of Applied Chemistry, Rajiv Gandhi College of Engineering, Research and Technology, Chandrapur (M.S) 2Department of Applied Chemistry, Bapurao Deshmukh College of Engineering, Sewagram, Wardha, M.S. ______________________________________________________________________________ ABSTRACT Water is one of the most abundantly available resources in nature. It is an essential constituent to all living beings. It occupies nearly 75% of matter of earth’s crust. But due to industrialization and urbanization natural water resources are lessening or declining to a great extent. A call for conservation and probable option for water resources is on peak. Limited1 natural rainfall- recharge and increased water usage throughout the country calls for conservation as well as augmentation .Physico-chemical monitoring of ground water samples of various reservoirs in Chandrapur town, was carried out. Water samples for above study were collected from 7 stations enlisting tube well, coal mine reservoir and rivers. Various parameters were analyzed by using standard methods (APHA) and their comparison with WHO standard values, suggested that most of the parameters were within permissible limit and by water treatment the concentration of parameters beyond the limits in coalmine could be reduced and could be an invaluable source for domestic purposes in the region. The present paper accounts water quality of various sites situated in Chandrapur and their efficiencies respectively. Keywords : Coal mine reservoir, augmentation, WHO Standard Values, Parameters, APHA, ______________________________________________________________________________ INTRODUCTION Water2 is a scarce and precious national resource to be planned, developed, conserved and managed as such, and on an integrated and environmentally sound basis, keeping in view the socio-economic aspects and needs of the States. Water is a prime natural resource and a basic 540
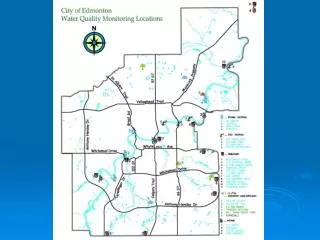
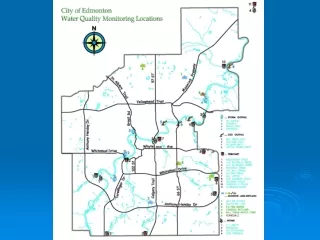
Sushma N. Thakre et al J. Chem. Pharm. Res., 2011, 3(3):540-546 ______________________________________________________________________________ human need. Surface Fresh water is a small fraction of global water. The freshwater supply is unevenly distributed. In India3 the average use of water for irrigation became very high after Green revolution. A4 2003 study conducted by the Congressional Government Accountability Office indicates that 36 states anticipate water shortages in the next ten years under normal water conditions, and 46 states expect water shortages under drought conditions. demand estimates by EPRI for the years 1995 and 2025 also indicate a high likelihood of local and regional water shortages in the United States. In4 India about 250 trillion litre of water are extracted for irrigation every year of which only about 150 trillion Liters are replaced by rain. In 1951 ,per capita availability of water in India was 5177 m3 which has reduced to extent of 1869 m3 in year 2001 and may come down to 1341 m3 in year 2025.It is estimated that out of total precipitation of around 400X104 million cubic metre per year in India, Surface water resources cover as 176.8X10⁴ million cubic meter and out of this only 50% can be put to beneficial use .An estimated total water use of 4074 million m3/day for year 2000-01 has been reported .The distribution among various uses is-domestic - 2.1%,Agriculture-88%,Industry-2.47%. It is estimated that 31% rural and 75% urban population in India has access to potable water supply. Surface water is dominant source in organized urban and rural area ground water is the basic source. The nature of pollutants entered in water depends on composition of waste water, the raw material processed, the process and toxicity of anions, cations, hydrocarbons constituted in waste. Freshwater availability is a critical limiting factor in economic development and sustainability and directly impacts electric-power supply. (a) Physiography : Chandrapur6 is located in the eastern edge of Maharashtra in 'Vidharbha' region. It is located between 19.30’ N to 20.45’N Latitude and 78.46’E longitude. The district is bounded by Nagpur, Bhandara and Wardha on the northern side, Yavatmal on the western side, Gadchiroli on the eastern side and Adilibad district of the Andhra Pradesh on the southern side. Physiographically, the district is situated within the Wainganga and Wardha river basins, respectively, flowing on the eastern and western boundries of the district which are the tributaries of Godavari River. Chandrapur district is abundantly endowed with rich flora and fauna. (b)Water Resources : Wardha, Wainganga and Penganga are the important rivers in Chandrapur district. The Wardha river flows into the district from the western boundary and then flows along the boundaries of Warora, Chandrapur, Korapna, Rajura, Ballarpur and Gondpipri Talukas. Penganga and Irai rivers meet the Wardha river. The drinking water supply projects in Chandrapur district includes 203 pipeline schemes, 171 tube wells, 4078 wells and 4514 Bore well/ Hand pumps in the entire district. Besides, the Municipal councils in Chandrapur district are depending on the various drinking water sources like Chandrapur municipal etc. (c) Ground water sources : About 85% of the state is covered by Deccan basalts whereas the rest of the state is covered by Quaternary alluvium. The total replenishable Groundwater Resource is of the order of 37.82 BCM/Yr. Provision for Domestic, Industrial & Other uses -12.40 BCM/Yr. Available Ground Water5 supply and 541
Sushma N. Thakre et al J. Chem. Pharm. Res., 2011, 3(3):540-546 ______________________________________________________________________________ Water Resources for irrigation- 25.47 BCM/Yr. Net Draft- 38 BCM /Yr.Chandrapur district shows ground water levels declining trend (more than 20 cm per year)in Pre-Monsoon (1995- 2004) (d) Study area : The Chandrapur town is located on 19.57’ north latitude and 79.18’ east longitudes in the eastern Maharashtra, and situated at 189.90 meter above form the mean sea level. Area of the city region is about 70.02 km². The district is situated in the Wainganga and Wardha river basin. The climate of Chandrapur is mostly tropical. Summer months are mostly hot and humid while the winter season is moderate and pleasant. EXPERIMENTAL SECTION Water samples from rivers,tubewell and mining area from various locations from Chandrapur city were collected and analyzed.For qualitative assessment water samples were collected in precleaned polypropylene bottles with necessary precautions (Standard Methods, 1992)7,8,9. Samples for dissolved oxygen (DO) analysis were taken in BOD bottles. Glassware used in the study were of high quality borosilicate brand. Chemicals used were of AR/GR grade and obtained from Qualigen/ E-Merck/Hi-media. A total of 7 samples from different sites were collected covering all major parts of the town. Table1. Description of water sampling sites : S.No. Sample code 1 WS1 Irai river,WCL area 2 WS2 Wardha river 3 WS3 Tube well, GEC campus 4 WS4 Zarpat river 5 WS5 Ramala lake 6 WS6 Irai Dam 7 WS7 Mahakali Under ground coal mine settling tank Table2. Values of physicochemical parameters of 7 sampling stations : Parameters/ Locations WS1 6.3 37 4.6 193 WS2 6.93 20 6.5 151.7 WS3 6.92 19 4.8 205 WS4 7.2 22 5.7 208.6 WS5 8.9 53 7.0 376.3 WS6 7.05 11 5.0 149.2 WS7 5.6 35 3.0 186 10 mg/l mg/l mg/l Location Total Hardness 468 321 413 390 689 307.8 577.3 500 mg/l pH COD DO Alkalinity Chloride Fluoride TDS Iron 94 45 43.8 101 66 45 25 200 mg/l 0.9 0.51 1.01 0.83 1.98 0.865 0.2 1.5 mg/l 1026 469 528 463 528 354 1312 500 mg/l 0.49 0.23 0.19 0.15 0.3 0.13 1.7 0.3 mg/l 4-6 200 WHO ,1991 7-8.5 542
Sushma N. Thakre et al J. Chem. Pharm. Res., 2011, 3(3):540-546 ______________________________________________________________________________ RESULT AND DISCUSSION Analytical results as depicted in table.2 revealed physicochemical characteristics of water samples from 7 locations of study area in the month of May 2010. Graphical Representation of Various Parameters : Fig 1 10 9 8 7 pH DO Fluoride Iron 6 5 4 3 2 1 0 Locations WS1 WS2 WS3 WS4 WS5 WS6 WS7 Fig 2 120 100 80 COD Chloride 60 40 20 0 Locations WS1 WS2 WS3 WS4 WS5 WS6 WS7 543
Sushma N. Thakre et al J. Chem. Pharm. Res., 2011, 3(3):540-546 ______________________________________________________________________________ Fig 3 Fig 4 Fig 5 800 700 Locations WS1 600 WS2 500 WS3 400 WS4 300 WS5 200 WS6 100 WS7 0 Alkalinity Total Hardness 800 700 Locations WS1 600 WS2 500 WS3 400 WS4 300 WS5 200 WS6 100 WS7 0 Alkalinity Total Hardness 1400 1200 Locations WS1 WS2 WS3 WS4 WS5 WS6 WS7 1000 800 600 400 200 0 TDS 544
Sushma N. Thakre et al J. Chem. Pharm. Res., 2011, 3(3):540-546 ______________________________________________________________________________ The results obtained were compared with their standards prescribed by WHO (1991 and BIS (1983).The value of pH was found in the range of 5.6-8.5 indicating alkalinity dominance. In WS1 and WS7 stations the acidic range may be due underground mining activities.High10 pH indicates the free availability of heavy metals as a result of their precipitation in hydroxide form. Alkaline range of pH may be due to occurance of limestone in the surrounding region of sampling stations. Acid- base equilibrium is also a controlling parameter for change in pH of the sample. Chemical oxygen demand (COD)values were found in the range of 11 -53 mg/l against its permissible limit of 10 mg/l.WS1,WS5 and WS7 possess high COD may be due to leaching of chemically degradable organic and inorganic matter from intensely populated surrounding area. Similar11,12 findings were reported by earlier workers. Chloride is one of the major inorganic anion of water. High concentration of chloride indicates pollution due to organic waste. Fluoride is important in human nutrition for normal development of bones. The required level is1.0-1.5 mg/l for drinking purpose. Excess13 concentration of fluoride causes dental diseases in calcification stage of children. If Fluoride consumption is less than 0.6 mg/l, it can lead to dental caries, malformation of bones, among children. Raw14 bauxite can be helpful in de- fluoridation of water with high fluoride value. Sampling station WS5 shows high fluoride concentration as compared to remaining stations. The low concentration of Iron may be due to less percentage of pyrites. The concentration of iron was in the range of 0.13-1.7 mg/l.WS7 possess high iron content due to underground blasting in mines. It is also very important to human and other organisms, as it is partially responsible for transporting oxygen through the bloodstream. Iron is easily dissolved in water and can be found naturally occurring in water bodies. A comparative study suggests that WS1 and WS7 shows high concentration of total dissolved solids as compared to other stations and WHO recommended limits. TDS is a general indicator of overall water quality. It is a measure of inorganic and organic materials dissolved in water. Increased TDS may impart a bad odor or taste to drinking water, as well as cause scaling of pipes and corrosion. High TDS level indicates water hardness in respective sampling station. It reduces the potability for drinking purposes in the region. The EPA's recommended maximum level of TDS in water is 500mg/L (500ppm). CONCLUSION From table 2 it can be concluded that most of the sampling stations shows permissible range of concentration in analysis meanwhile some of them are highly polluted. In mining area the regular monitoring is required because it is situated in populated area and hence can affect the health of local pupil of Chandrapur. For domestic utility the primary treatment on mining water is an essential step to be taken. It can be an alternative to other water resources in period of water shortage in the region .But treatment on discharge water is an essential aspect for the above purpose. 545
Sushma N. Thakre et al J. Chem. Pharm. Res., 2011, 3(3):540-546 ______________________________________________________________________________ Acknowledgement Authors are thankful to Principal RCERT college of engineering (Chandrapur) and Principal B.D college of Engg. for providing necessary facilities to complete the above assessment and their constant encouragement. REFERENCES [1] Gaikwad P.G , Artificial recharge methods of groundwater, NDMVP Samaj’s college of Engineering, Udoji Maratha Boarding Campus, pumping station, Gangapur road, Nashik- 422013. [2]National water policy, Ministry of water resources, 2000 [3]Ingole N, Dharmadhikari D., Patil S. Environmental chemistry and pollution control, Das ganu Prakashan, 1st Edition, 2010,180-184. [4]United States General Accounting Office. Freshwater Supply, States’ Views of How Federal Agencies Could Help Them Meet the Challenges of Expected Shortages; GAO Report No. GAO-03-514, July 2003. [5]Electric Power Research Institute. A Survey of Water Use and Sustainability in the United States with a Focus on Power Generation; EPRI Report No. 1005474; Nov 2003. [6]Maharashtra Pollution Control Board MPCB,MUMBAI - 400 022, 2006 [7]APHA. Standard Methods for the Examination of Water and Wastewater, 18th Edition, American Public Health Association, Washington, D.C 1992 [8]WHO. Guidelines for drinking water quality .Vol.2, 1984 [9]NEERI. Mannual for water and waste water, 1986 [10]Gupta L.N; Singh A; Gupta G.S.; IJEP 29(8): 2009, 71-72. [11]Jameel A.; Hussain A.Z; IJEP(27), 2007, 71-73 [12]Wagh S.P.; Shrivastava V.S.; IJEP (27), 2007,165-167 [13]Sharma S.K; Singh C.P; Aqua-cutt.,6(2), 2005,197-204. [14]Sajidu S.M; Masamba W.R.L.; Mwatseteza J.F.; Int,J.Physical sci.,3(1),2008 1-11 546