Download
1 / 10
100 likes | 136 Vues
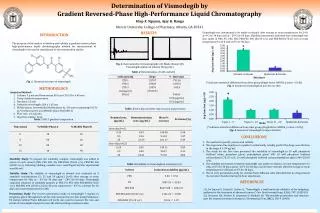
New, simple, rapid and precise reversed phase liquid chromatographic method has been developed and validated for the simultaneous determination of atenolol, amiloride hydrochloride and hydrochlorothiazide. Chromatographic separation was carried out on a C18 column with a<br>mobile phase consisting of 25 mM sodium acetate anhydrous: acetonitrile: triethylamine (95:5:0.1%, v/v/v) at a flow rate 0.9 ml min-1 at ambient temperature. Quantitation was achieved<br>with UV detection at 280 nm. Linearity, accuracy and precision were found to be acceptable over the concentration range of (5–50 µg ml–1) for atenolol, (0.25–2.5 µg ml–1) for amiloride<br>hydrochloride and (1.25–25 µg ml–1) for hydrochlorothiazide. The optimized method proved to be specific, robust and accurate for the quality control of the cited drugs in <br> harmaceutical preparation. <br>

E N D
www.jocpr.com Available online Journal of Chemical and Pharmaceutical Research __________________________________________________ J. Chem. Pharm. Res., 2011, 3(6):320-329 ISSN No: 0975-7384 CODEN(USA): JCPRC5 Simultaneous determination of Atenolol, Amiloride hydrochloride and Hydrochlorothiazide using reversed phase liquid chromatography Ramzia I. El-Bagary, Ehab F. Elkady and Abdul Jabbar Faqeh* Pharmaceutical Chemistry Department, Faculty of Pharmacy, Cairo University, Kasr El-Aini St., Cairo, Egypt ______________________________________________________________________________ ABSTRACT New, simple, rapid and precise reversed phase liquid chromatographic method has been developed and validated for the simultaneous determination of atenolol, amiloride hydrochloride and hydrochlorothiazide. Chromatographic separation was carried out on a C18 column with a mobile phase consisting of 25 mM sodium acetate anhydrous: acetonitrile: triethylamine (95:5:0.1%, v/v/v) at a flow rate 0.9 ml min-1 at ambient temperature. Quantitation was achieved with UV detection at 280 nm. Linearity, accuracy and precision were found to be acceptable over the concentration range of (5–50 µg ml–1) for atenolol, (0.25–2.5 µg ml–1) for amiloride hydrochloride and (1.25–25 µg ml–1) for hydrochlorothiazide. The optimized method proved to be specific, robust and accurate for the quality control of the cited drugs in pharmaceutical preparation. Keywords:Atenolol; Amiloride hydrochloride; hydrochlorothiazide; Reversed phase liquid chromatography; pharmaceutical preparation. ______________________________________________________________________________ INTRODUCTION Atenolol (AT); (RS)-2-{4-[2-hydroxy-3-(propan-2-ylamino) propoxy]phenyl} acetamide (Fig.1A) is a β1-selective (cardioselective) adrenoreceptor antagonist drug commonly used for management of hypertension, prevention of heart diseases as angina pectoris and control of some forms of cardiac arrhythmia [1]. Amiloride hydrochloride (AM); 3,5-diamino-6-chloro-N- (diaminomethylene) pyrazine-2-carboxamide (Fig.1B) is a mild diuretic that acts by blocking sodium channels in the late distal tubules and collecting ducts. By increasing the loss of sodium and chloride ions while reducing the excretion of potassium, AM. adds to the natriuretic effects of other diuretics, while diminishing their kaliuretic effects [2]. 320
Abdul Jabbar Faqeh et al J. Chem. Pharm. Res., 2011, 3(6):320-329 ______________________________________________________________________________ Hydrochlorothiazide sulphonamide (Fig.1C) is a thiazide diuretic that increases sodium and chloride excretion by distal convoluted tubule [1]. Literature survey reveals that several analytical methods have been reported for the determination of AT alone or in combination including spectrophotometry[6-13], spectrofluorimetry [14-17], HPLC [18-26]. AT,AM and chlorothalidone were simultaneously determined by HPLC and chemometric-assisted spectrophotometry [27], capillary zone electrophoresis[28-32], Voltametry [33] and TLC [34]. Besides, several analytical methods have been reported for the determination of AM alone or in combination with other drugs including spectrophotometry [35], spectroflourometry [36,37], gas chromatography [38] and HPLC [39] & [40,41]. Also several analytical methods have been reported for the determination of HT alone or in combination with other drugs, including spectrophotometry [42-62], TLC-densitometry and spectrofluorimetry [63], HPLC [64-74], HPTLC [75-77], LC [78-80] spectrophotometry, HPLC and HPTLC [81]. The ternary mixture of AT, AM, and HT has only been determined by derivative spectroscopy [3] and by chemometric-assisted spectrophotometric method with timolol [5]. Besides, a reversed-phase liquid chromatographic method has been described for the determination of AM, AT, HT in their combined mixtures but applying cyanopropyl column not C18 column [4]. Due to the wide use and availability of C18 columns, our aim was to develop and validate an alternative reversed-phase liquid chromatographic method for the determination of the ternary mixture under investigation applying C18 columns. (HT); 6-chloro-1,1-dioxo-3,4-dihydro-2H-1,2,4-benzothia-zine-7- O N H H N O NH2 Cl OH NH2. Cl N C N C HCl . 2H2O HN NH2 S S O O O O O H2N N NH2 CH2 NH2 (Fig.1 C) Hydrochlorothiazide (Fig.1 A) Atenolol (Fig. 1 B) Amiloride EXPERIMENTAL SECTION 2.1. Instrumentation A chromatographic system consisting of Agilent 1100 series; interface equipped with an Agilent isocratic pump G1310A, Agilent UV-visible detector G1314A, an Agilent manual injector G1328B equipped with (20 µl) injector loop, and Agilent Zorbax C18 column (5µm, 4.6 x 250 mm) was used. Agilent syringe, LC 100 µl , CA, U.S.A. Ultrasonic processor; Soniclean 120T, 220/240v, 50/60Hz, 60W, Thebarton SA, Australia were used. Pharmaceutical grade of AT and AM were supplied and certified by Ramida company (Cairo- Egypt) to contain 99.8, 99.9%, respectively. Pharmaceutical grade HT was supplied and certified by EPICO company (10th of Ramadan- Egypt) to contain 99.85%. Atenoretic capsules (Manufactured by Sigma pharmaceutical Industries for Queen Pharm International) were labeled to contain 50 mg AT, 2.5 mg AM and 25 mg HT. 321
Abdul Jabbar Faqeh et al J. Chem. Pharm. Res., 2011, 3(6):320-329 ______________________________________________________________________________ Acetonitrile used was HPLC grade (LAB-SCAN, Poland). Bi-distilled water was produced in- house (Aquatron Water Still, A4000D, UK). Membrane filters 0.45 µm from Teknokroma (Barcelona, Spain) were used. All other chemicals and reagents used were of analytical grade unless indicated otherwise. 2.3. Chromatographic conditions Chromatographic separation was achieved on an Agilent Zorbax C18 column (5µm, 4.6 x 250 mm) applying an isocratic elution based on 25mM sodium acetate anhydrous buffer: acetonitrile: triethylamine (95:5:0.1%, v/v/v) as a mobile phase. The pH of the mobile phase was adjusted to 2.9 using acetic acid. The mobile phase was pumped through the column at a flow rate of 0.9 ml min-1. The injection volume was 20 µl. Analyses were carried out at ambient temperature and detection was carried out at 280 nm for the three drugs. 2.4. Standard solutions Standard solutions of each of AT, AM and HT were prepared by separately dissolving 50 mg, 25 mg & 25 mg respectively in 100 ml mobile phase then further dilutions were made to obtained (0.5 mg ml-1) AT, (0.025 mg ml-1) AM & (0.25 mg ml-1) HT, within the concentration rang of 5– 50 µg ml-1 for AT, 0.25–2.5 µg ml-1 for AM and 1.25–25 µg ml-1 for HT. 2.5. Sample preparation The contents of twenty capsules were weighed and mixed in a mortar. An accurately weighed portion of the powder equivalent to about 50 mg of AT, 2.5 mg of AM and 25 mg HT was extracted and diluted to 100 ml with the mobile phase. The sample solution was filtered. Further dilution of the filtrate was carried out with the mobile phase to provide a solution of 50 µg ml–1 of AT, 2.5 µgml–1 of AM and 25 µg ml–1 of HT. 2.6. Procedure 2.6.1. Linearity and repeatability Accurately measured aliquots of working standard solutions equivalent to 50–500 µg ml-1 for AT, 2.5–25 µg ml-1 for AM and 12.5–250 µg ml-1 for HT were transferred into three series of 10mL volumetric flasks. The volumes were completed with the mobile phase. A volume of 20 µl of each solution was injected in triplicates into the chromatograph under the specified chromatographic conditions described previously. A calibration curve for each compound was obtained by plotting area under the peak (AUP) against concentration (C). The repeatability of the method was assessed by analyzing a laboratory prepared mixture containing 20 µg mL-1,10 µg mL-1and 1.0 µg mL-1 for AT, HT and AM (n= 6). The precision (R.S.D %) for each compound was calculated. 2.6.2. Assay of laboratory prepared mixtures and Atenoretic ® capsules The procedure mentioned under 2.6.1. was repeated using laboratory prepared mixtures equivalent to 5-50 µg mL-1AT, 0.25-2.5 µg mL-1 AM and 1.25-25 µg mL-1 HT. For the determination of the examined drugs in Atenoretic ® capsules, the sample solution prepared under 2.5. was diluted to prepare different solutions equivalent to 7.5-40 µg mL-1AT, 0.25-2 µg mL-1 AM and 1.25-20 µg mL-1 µg mL-1 HT and injected in triplicated into the chromatograph. RESULTS AND DISCUSSION A previous work [4] described the LC determination of the three drugs under investigation applying cyanopropyl column not C18 column. So, the aim of this work was to develop a new, 322
Abdul Jabbar Faqeh et al J. Chem. Pharm. Res., 2011, 3(6):320-329 ______________________________________________________________________________ simple, accurate and reproducible LC method for the simultaneous determination of AT, AM and HT applying C18 columns due to its wide availability and versatility in all quality control laboratories. Table 1: System suitability results of the proposed method. Compound N R % R.S.D. of tR Peak Area 1.05 0.48 T HT AT AM 3208 2606 4.04 1.03 0.64 2531 4.07 1.07 0.25 - 0.28 0.38 0.63 (N: Number of theoretical plates; R: resolution factor; T: Tailing factor; tR: retention time) 3.1. Method development For the separation of the examined drugs, various reversed-phase C18 columns, isocratic mobile phase systems were attempted. The mobile phase composition and pH were studied and optimized. A satisfactory separation was obtained with a mobile phase composed of 25mM sodium acetate anhydrous buffer, acetonitrile and triethylamine in the ratio of (95:5:0.1%, v/v/v), adjusted to pH 2.9 using acetic acid. At low acetonitrile concentration (<10%), separation was obtained but with excessive tailing for AM peak. At pH 2.9, optimum resolution with reasonable retention time was observed. Quantitation based on peak area achieved with UV detection at 280 nm where high sensitivity was obtained for the three drugs. 3.2. Validation of the method 3.2.1. Linearity Linearity was studied for AT, AM and HT. A linear relationship between area under the peak (AUP) and component concentration (C) was obtained. The regression equation for each drug was also computed (Table 2) in this study, 6 concentrations for each compound were used. The linearity of the calibration curves were validated by the high value of correlation coefficients (Table 2) The analytical data of the calibration curves including standard deviations for the slope and intercept (Sb, Sa) are summarized in (Table 2) 3.2.2. Accuracy Accuracy of the results was calculated by % recovery of laboratory prepared mixtures of 6 different concentrations of the AT, AM and HT and also by standard addition technique for Atenoretic® capsules. The results obtained including the mean of the recovery, standard deviation, relative standard deviation are displayed in (Table 2) 3.2.3. Precision Precision was estimated by repeatability. The repeatability of the method was assessed by analyzing a mixture containing 20 µg mL-1,10 µg mL-1and 1 µg mL-1 for AT, HT and AM (n = 6), respectively. The values of the repeatability (%R.S.D) and inter-day and intra-day precision (using 3 different concentrations in triplicates for three days) for the three drugs are displayed in (Table 2) 3.2.4. Specificity Specificity is the ability of the analytical method to measure the analyte response in the presence of interferences. In the present work, the chromatograms of the samples were checked for the appearance of any extra peaks. No chromatographic interference from any of the excipients was found at the retention times of the examined drugs, Fig.2 In addition, the chromatogram of each drug in the sample solution is identical to the spectrum received by the standard solution at the 323
Abdul Jabbar Faqeh et al J. Chem. Pharm. Res., 2011, 3(6):320-329 ______________________________________________________________________________ wavelengths applied. These results demonstrate that there was no interference from other materials in the pharmaceutical formulations and therefore confirm the specificity of the method. mAU HT AT 25 AM 20 15 10 5 0 0 2 4 6 8 Mint Figure 2: A typical LC chromatogram of 25µL injector of Atenoretic® sample solution. Table 2: Assay parameters and method validation obtained by applying HPLC method for the simultaneous determination of atenolol, amiloride HCl and hydrochlorothiazide in mixture Item Atenolol 5.672 min 280 nm 0.00138 0.00419 5-50 µg ml-1 y = 4.3539x-1.2938 0.9990 2.275 172.943 4.3539±752.977 1.2938±2.943 88.723 Hydrochlorothiazide 4.489 min 280 nm 1.012 3.067 1.25-25µg ml-1 y = 47.566x + 4.8445 0.9992 30.649 425.750 47.566±20251.225 4.844±148.464 671.805 Amiloride HCl 7.466 min 280 nm 1.41179 x 10⁻⁵ 4.278 x 10⁻⁵ 0.25-2.5 µg ml-1 Y= 54.55x-0.0468 0.9997 28.707 40.809 54.55±2226.131 0.0468±1.343 57.115 Retention time Wavelength of detection LOD LOQ Range of linearity Regression equation correlation coefficient (r2) Sb Sa Confidence limit of the slope Confidence limit of the intercept Standard error of the estimation Intra daya %R.S.D. Inter dayb %R.S.D. Drug in dosage form a The intraday (n = 3), average of three concentrations (8, 10, 12 µg Ml−1) for AT, (4, 5, 6 µg Ml−1)forHT and(0.4, 0.5, 0.6 µg Ml−1) for AM repeated three times within the day. b The interday (n = 3), average of three concentrations(8, 10, 12 µg Ml−1) for AT, (4, 5, 6 µg Ml−1)forHT and(0.4, 0.5, 0.6 µg Ml−1) for AM repeated three times within the day. 0.921-1.01 0.54-1.23 0.35-1.4 0.936-1.278 0.73 -1.68 0.48-1.49 99.46±0.961 101.17±1.23 99.7±1.77 3.2.5. Range The calibration range was established through consideration of the practical range necessary, according to each compound concentration present in the pharmaceutical product, to give accurate, precise and linear results. The calibration range of the proposed HPLC method is given in (Table 2) 324
Abdul Jabbar Faqeh et al J. Chem. Pharm. Res., 2011, 3(6):320-329 ______________________________________________________________________________ 3.2.6. Limit of detection and limit of quantification Limit of detection (LOD) which represents the concentration of analyte at S/N ratio of 3 and limit of quantification (LOQ) at which S/N is 10. According to ICH recommendations [82], the approachbased on the S.D. of the response and the slope was used fordetermining the detection and quantitation limits. The theoreticalvalues were assessed practically and given in Table (Table 2). 3.2.7. Robustness Robustness is a measure of the method ability to remain unaffected by small variations in the method conditions and is an indication of the method reliability. Robustness was performed by deliberately changing the chromatographic conditions. Variation of pH of the mobile phase by ± 0.2 and its organic strength by ± 2% did not have any significant effect on chromatogram Fig. 3. The flow rate of the mobile phase was changed from 0.9 mL min-1 to 0.7 mL min-1 and 1.1 mL min-1. The organic strength was varied by ± 2%, while pH was varied by ±0.1 units. Concentration of Sodium acetate anhydrous buffer was varied by ± 2%. The most important parameter to be studied was the resolution factor between the three peaks of AT, HT and AM. As can be seen in(Table 3-6), good values of the resolution factor were obtained for all these variations, indicating good robustness of the proposed LC method. It is worth noting that an increase in the organic modifier resulted in an increase in the retention time of AT., HT and vice versa. AM. was not much affected by the change of the organic modifier. mAU HT 25 AT 20 AM 15 10 5 0 0 2 4 6 8 Mint Figure 3: A typical LC chromatogram of 20µL injector of synthetic binary mixture of hydrochlorothiazide (HT) (25µg mL-1), atenolol (AT) (50µg mL-1) and amiloride hydrochloride (AM) (2.5µg mL-1). Table 3: Influence of flow rate of the mobile phase on resolution of peaks. 0.7mLmin-1 5.57 7.67 0.9 mLmin-1 1.1 mLmin-1 5.47 7.57 Item Resolution factor HT –AT Resolution factor AT-AM 5.27 7.26 Table 4: Influence of organic strength of the mobile phase on resolution of peaks Item Resolution factor HT –AT 5.54 5.47 5.31 Resolution factor AT-AM 3% 5% 7% 7.46 7.57 7.32 325
Abdul Jabbar Faqeh et al J. Chem. Pharm. Res., 2011, 3(6):320-329 ______________________________________________________________________________ Table 5: Influence of pH of the sodium acetate anhydrous buffer on resolution of peaks Item Resolution factor HT –AT Resolution factor AT-AM Table 6: Influence of concentration of Sodium acetate anhydrous buffer on resolution of peaks Item Resolution factor HT –AT Resolution factor AT-AM Ph 2.8 Ph 2.9 Ph 3.0 5.32 5.47 7.47 7.57 5.58 7.66 23Mm 25Mm 27Mm 5.42 5.47 7.42 7.57 5.38 7.46 3.3. Statistical analysis of the results A statistical analysis of the results obtained by the proposed method and the reference methods was carried out by “SPSS statistical package version 11”. The significant difference between groups was tested by (T-test) and (F-test) at p=0.05 as shown in (Table 7). The test ascertained that there was no significant difference among the methods. Table 7: Statistical analysis of the results obtained by the proposed LC method and the reference methods Item Mean S.D. R.S.D. n Variance t-value F-value * Figures in parentheses are the corresponding theoretical t -and F-values at P = 0.05. ** Reference method for AT using potentiometric method according to B.P [83] *** Reference method for HT using HPLC method according to U.S.P. [84] **** Reference method for AM using potentiometric method according to B.P. [83] AT HT AM Reference method** HPLC 100.26 0.493 0.492 6 0.243 0.4266 (2.228)* 3.897(5.05)* Reference method*** 99.73 0.8801 0.8824 6 0.775 0.3027(2.228)* 2.3794(5.05)* Reference method**** 100.00 0.3688 0.401 6 0.136 0.1490(2.228)* 4.375(5.05)* HPLC 100.45 0.9731 0.9687 6 0.947 HPLC 100.052 0.7711 0.7706 6 0.595 99.93 1.3578 1.3588 6 1.844 CONCLUSION The proposed HPLC method provides simple, accurate and reproducible quantitative analysis for the simultaneous determination of atenolol, hydrochlorothiazide and amiloride HCl in capsules. This method was validated as per ICH guidelines. The proposed method is suitable for the quality control determination of the cited drugs in ordinary laboratories. REFERENCES [1] Goodman and Gilman's, in: A.G. Gilman, T.W. Rall, A.S. Nies, P. Taylor (Eds.), the Pharmacological Basis of Therapeutics. Pergamon Press, Oxford, 1996. [2] J.G.F. Reynolds (Ed.), Martindale: The Extra Pharmacopoeia, 29th ed., The Pharmaceutical Press, London, 1989, pp.977/978, 991/993. [3] Prasad, C., et al., J. Pharm. Biomed. Anal, 1998. 17: p. 877–884. [4] Elshanawane, A.A., S.M. Mostafa, and M.S. Elgawish, Journal of AOAC International,2009. 92(2): p. 404-409. [5]Ferraro, M.C.F., P.M. Castellano, and T.S. Kaufman, Journal of pharmaceutical and biomedical analysis,2004. 34(2): p. 305-314. [6]Yilmaz, B., et al., FABAD J. Pharm. Sci, 2008. 33: p. 119-129. 326
Abdul Jabbar Faqeh et al J. Chem. Pharm. Res., 2011, 3(6):320-329 ______________________________________________________________________________ [7]Prasad, U., G. Rao, and C. Sastry, Indian Journal of Pharmaceutical Sciences,2002. 64(2): p. 129-132. [8]Basavaiah, K., U. Chandrashekar, and P. Nagegowda, Journal of the Serbian Chemical Society, 2006. 71(5): p. 553-563. [9]G lcü, A., C. Yücesoy, and S. Serin, Il Farmaco, 2004. 59(6): p. 487-492. [10]Salem, H., Journal of pharmaceutical and biomedical analysis,2002. 29(3): p. 527-538. [11]Kasture, A. and M. Ramteke, Indian Journal of Pharmaceutical Sciences, 2006. 68(3): p. 394. [12]Prasad, C., et al., Pharmacy and Pharmacology Communications, 1998. 4(7): p. 325-330. [13]Bashir, N., S. Shah, and M. Bangesh, A novel spectrophotometric determination of atenolol using sodium nitroprusside. [14]Andreetta, H.A. and L. Bruzzone, Analytical Letters, 2008. 41(1): p. 36-45. [15]Patel, S., et al., Indian Journal of Pharmaceutical Sciences,2005. 67(2): p. 224-226. [16]Abdine, H., et al., Pharmazie,2005. 60(4): p. 265-268. [17]de Castro, B., et al., Journal of pharmaceutical and biomedical analysis, 1998. 18(4-5): p. 573-577. [18]Chiu, F., et al., Journal of Chromatography B: Biomedical Sciences and Applications, 1997. 691(2): p. 473-477. [19]Santoro, M., H. Cho, and E. Kedor-Hackmann, Drug development and industrial pharmacy, 2000. 26(10): p. 1107-1110. [20]Park, Y.J., D.W. Lee, and W.Y. Lee, Analytica Chimica Acta, 2002. 471(1): p. 51-59. [21]Ceresole, R., et al., Journal of liquid chromatography & related technologies, 2006. 29(17- 20): p. 3009-3019. [22]Venkatesh, G., et al., Journal of pharmaceutical and biomedical analysis, 2007. 43(4): p. 1546-1551. [23]Ranta, V.P., et al., Journal of Chromatography B: Analytical Technologies in the Biomedical and Life Sciences, 2002. 772(1): p. 81-87. [24]BARMAN, R.K., et al., Pak. J. Pharm. Sci, 2007. 20(4): p. 274-279. [25]El Gindy, A., S. Sallam, and R.A. Abdel Salam, Journal of separation science, 2008. 31(4): p. 677-682. [26]Leite, F.S., et al., Therapeutic drug monitoring,2006. 28(2): p. 237. [27]El-Gindy, A., S. Emara, and A. Mostafa, Il Farmaco, 2005. 60(3): p. 269-278. [28]Maguregui, M., R. JimAnez, and R. Alonso, Journal of chromatographic science, 1998. 36(10): p. 516-522. [29]Arias, R., et al., Journal of Chromatography A, 2001. 916(1-2): p. 297-304. [30]Shafaati, A. and B. Clark, Journal of pharmaceutical and biomedical analysis, 1996. 14(11): p. 1547-1554. [31]Al Azzam, K.M., B. Saad, and H.Y. Aboul Enein, Biomedical Chromatography,2010. 24(9): p. 977-981. [32]Al Azzam, K.M., B. Saad, and H.Y. Aboul Enein, Biomedical Chromatography,2010. 24(9): p. 948-953. [33]Goyal, R.N. and S.P. Singh, V, Talanta, 2006. 69(4): p. 932-937. [34]Abdelwahab, N.S., Anal. Methods, 2010. [35]Ferraro, M.C.F., P.M. Castellano, and T.S. Kaufman, Journal of pharmaceutical and biomedical analysis, 2002. 30(4): p. 1121-1131. [36]Pulgar n, J.A.M., A.A. Molina, and P.F. L pez, Analyst, 1997. 122(3): p. 247-252. [37]Pulgar n, J.A.M., A.A. Molina, and P.F. L pez, Analytica Chimica Acta, 2001. 449(1-2): p. 179-187. [38]Goni-Allo, B., et al., European journal of pharmacology,2007. 562(3): p. 198-207. [39]Song, M., et al., Rapid Communications in Mass Spectrometry, 2007. 21(21): p. 3427-3434. 327
Abdul Jabbar Faqeh et al J. Chem. Pharm. Res., 2011, 3(6):320-329 ______________________________________________________________________________ [40]Zecevic, M., et al., Journal of pharmaceutical and biomedical analysis, 2000. 22(1): p. 1-6. [41]Zeevi, M., Journal of pharmaceutical and biomedical analysis, 2001. 24(5-6): p. 1019-1025. [42]Erk, N., Analytical Letters,2002. 35(2): p. 283-302. [43]Erk, N., Die Pharmazie-An International Journal of Pharmaceutical Sciences,2003. 58(8): p. 543-548. [44]Erk, N., Journal of pharmaceutical and biomedical analysis, 2002. 27(6): p. 901-912. [45]Erk, N., Die Pharmazie-An International Journal of Pharmaceutical Sciences, 2003. 58(11): p. 796-800. [46]Erk, N., Journal of pharmaceutical and biomedical analysis, 2001. 24(4): p. 603-611. [47]Sahu, R. and V.B. Patel, Indian Journal of Pharmaceutical Sciences,2006. 68(6): p. 764. [48]Rote, A. and P. Bari, Indian Journal of Pharmaceutical Sciences, 2010. 72(1): p. 111. [49]Ouyang, J., W. Baeyens, and J. Delanghe, Talanta, 1998. 46(5): p. 961-968. [50]Bankey, S., et al., International Journal of ChemTech Research, 2009. 1: p. 183-188. [51]Bhusari, K., et al., Indian Journal of Pharmaceutical Sciences, 2009. 71(5): p. 505. [52]Wankhede, S., et al., Indian Journal of Pharmaceutical Sciences,2010. 72(1): p. 136. [53]Bhatia, M., et al., J Pharm Res and Health Care, 2010. 2(1): p. 2-14. [54]Gupta, K., M. Tajne, and S. Wadodkar, Indian Journal of Pharmaceutical Sciences,2008. 70(4): p. 511. [55]Banoglu, E., Y.I. zkan, and O. Atay, Il Farmaco,2000. 55(6-7): p. 477-483. [56]VICHARE, V., et al., Int J Chem Res, 2011. 2(1). [57]Dinç, E., Analytical Letters,2002. 35(6): p. 1021-1039. [58]Vignaduzzo, S.E., et al., Analytical and Bioanalytical Chemistry,2006. 386(7): p. 2239- 2244. [59]Behera, A., Simultaneous Spectrophotometric Hydrochlorothiazide in Tablet Dosage Forms. [60]Gangola, R., S. Kaushik, and P. Sharma, Journal of Applied Pharmaceutical Science, 2011. 1(01): p. 46-49. [61]Thomas, A., et al., Hindustan antibiotics bulletin, 2009. 51(1-4): p. 33. [62]Carlucci, G., L. Di Federico, and P. Iuliani, Analytical Letters,2010. 43(16): p. 2609-2617. [63]Bebawy, L.I., et al., Il Farmaco, 2005. 60(10): p. 859-867. [64]Wankhede, S., et al., Indian Journal of Pharmaceutical Sciences, 2007. 69(2): p. 298. [65]Patel, L., et al., Indian Journal of Pharmaceutical Sciences,2006. 68(5): p. 635. [66]Rane, V., J. Sangshetti, and D. Shinde, Journal of chromatographic science, 2008. 46(10): p. 887-891. [67]Shaikh, S., et al., Journal of pharmaceutical and biomedical analysis, 2008. 48(3): p. 1055- 1057. [68]Joshi, S.J., et al., Journal of pharmaceutical and biomedical analysis,2010. 52(3): p. 362- 371. [69]Obando, M.A., J.M. Estela, and V. Cerdà, Analytical and Bioanalytical Chemistry,2008. 391(6): p. 2349-2356. [70]Gupta, Y., et al., Journal of Young Pharmacists,2009. 1(3): p. 264. [71]Hertzog, D.L., et al., Journal of pharmaceutical and biomedical analysis, 2002. 30(3): p. 747-760. [72]Maitreyi, Z. and A. Khandhar, International Journal of Advances in Pharmaceutical Sciences, 2011. 1(2). [73]Brijesh, S., D. Patel, and S. Ghosh, Tropical Journal of Pharmaceutical Research, 2010. 8(6). [74]Gandhimathi, M. and T. Ravi, Indian Journal of Pharmaceutical Sciences, 2009. 71(3): p. 311. [75]Shah, N., et al., Indian Journal of Pharmaceutical Sciences, 2009. 71(1): p. 72. Estimation of Atenolol and 328
Abdul Jabbar Faqeh et al J. Chem. Pharm. Res., 2011, 3(6):320-329 ______________________________________________________________________________ [76]Shah, N., et al., Indian Journal of Pharmaceutical Sciences,2007. 69(6): p. 834. [77]Bhavar, G.B., et al., Indian Journal of Pharmaceutical Sciences, 2008. 70(4): p. 529. [78]Erk, N., Journal of chromatography B, 2003. 784(1): p. 195-201. [79]Li, H., et al., Journal of chromatography B, 2007. 852(1-2): p. 436-442. [80]Tagliari, M.P., et al., Chromatographia, 2008. 67(7): p. 647-652. [81]Dhandapani, B., N. Thirumoorthy, and D.J. PRAKASH, E-Journal of Chem,2010. 7: p. 341- 348. [82] The European Agency for the Evaluation of Medical Products, ICH Topic Q2B Note for Guidance onValidation of Analytical Procedures: Methodology GPMP/ICH/281/95, (1996). [83] BritishPharmacopoeia, 2003 volume 1 page (112,172) [84] United State Pharmacopoeia, 2005. USP, NF, page 954 329